Here Comes the Rain Again
December 2, 2021

Rob Hajduch, Principal Credit Analyst
As discussed in our June 2021 piece (“Loan Lee at the Top”), the domestic banking system entered an extended period of loan balance attrition after an unprecedented spike in commercial and industrial (C&I) loan expansion in the early days of the COVID-19 outbreak. Simultaneously, the system experienced record deposit inflow, resulting in a historically wide gap between total gross system loans and total deposit balances.
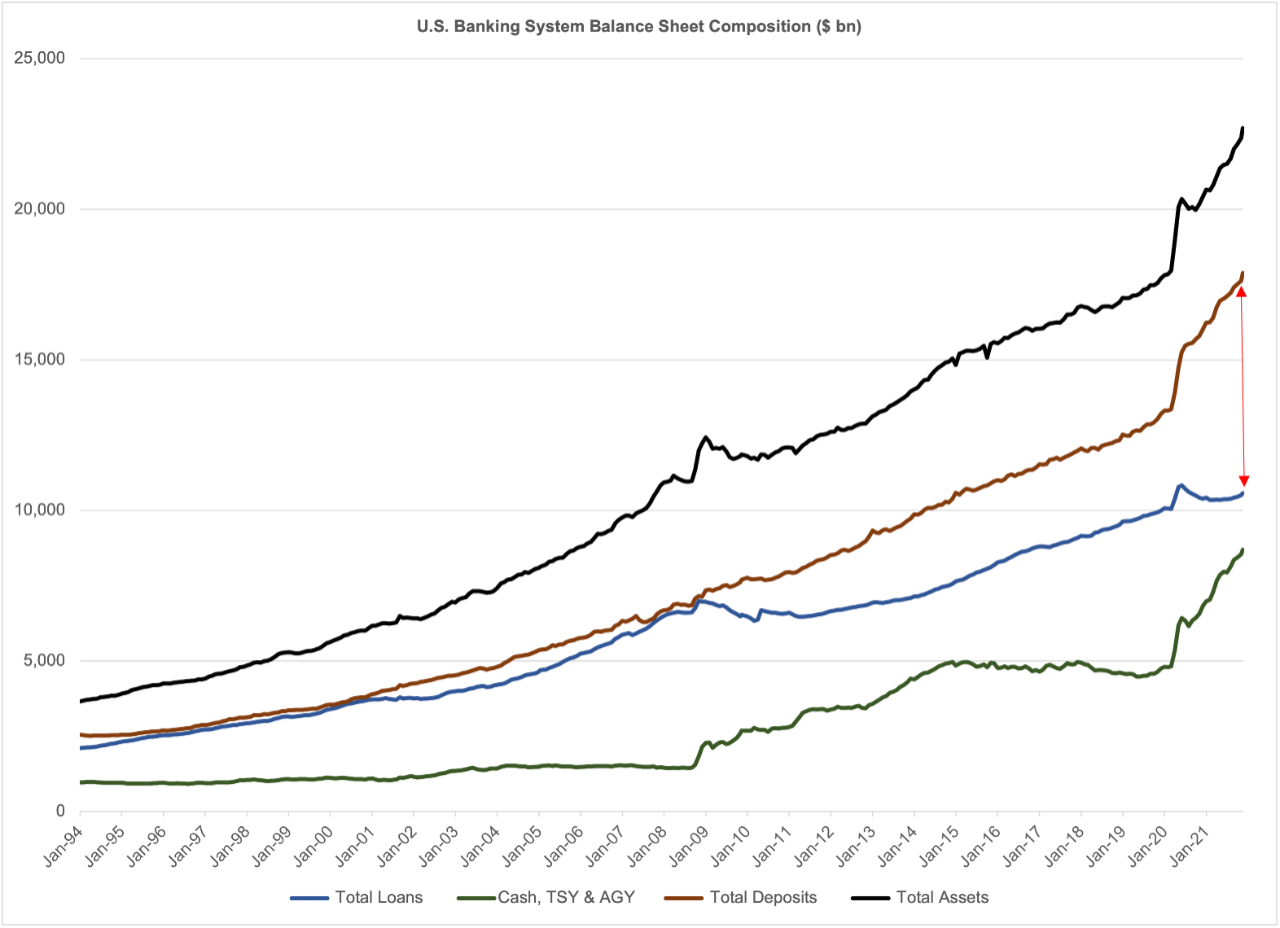
The flood of deposits coupled with weak demand for credit drove a surge in investment into inherently low-yielding cash equivalent, U.S. Treasury and government agency securities that has carried over into late-2021, with such assets increasing by over 80% through November 2021 from the level reported prior to the pandemic outbreak. The chart above illustrates the evolution in the system’s collective balance sheet. At the last available data point (November 17, 2021), loans were equivalent to 46.6% of total assets, down from 55.9% at the end of February 2020, with loans displaced by cash, Treasury and Agency securities, which have increased to 38.3% of total system assets from 26.8%.
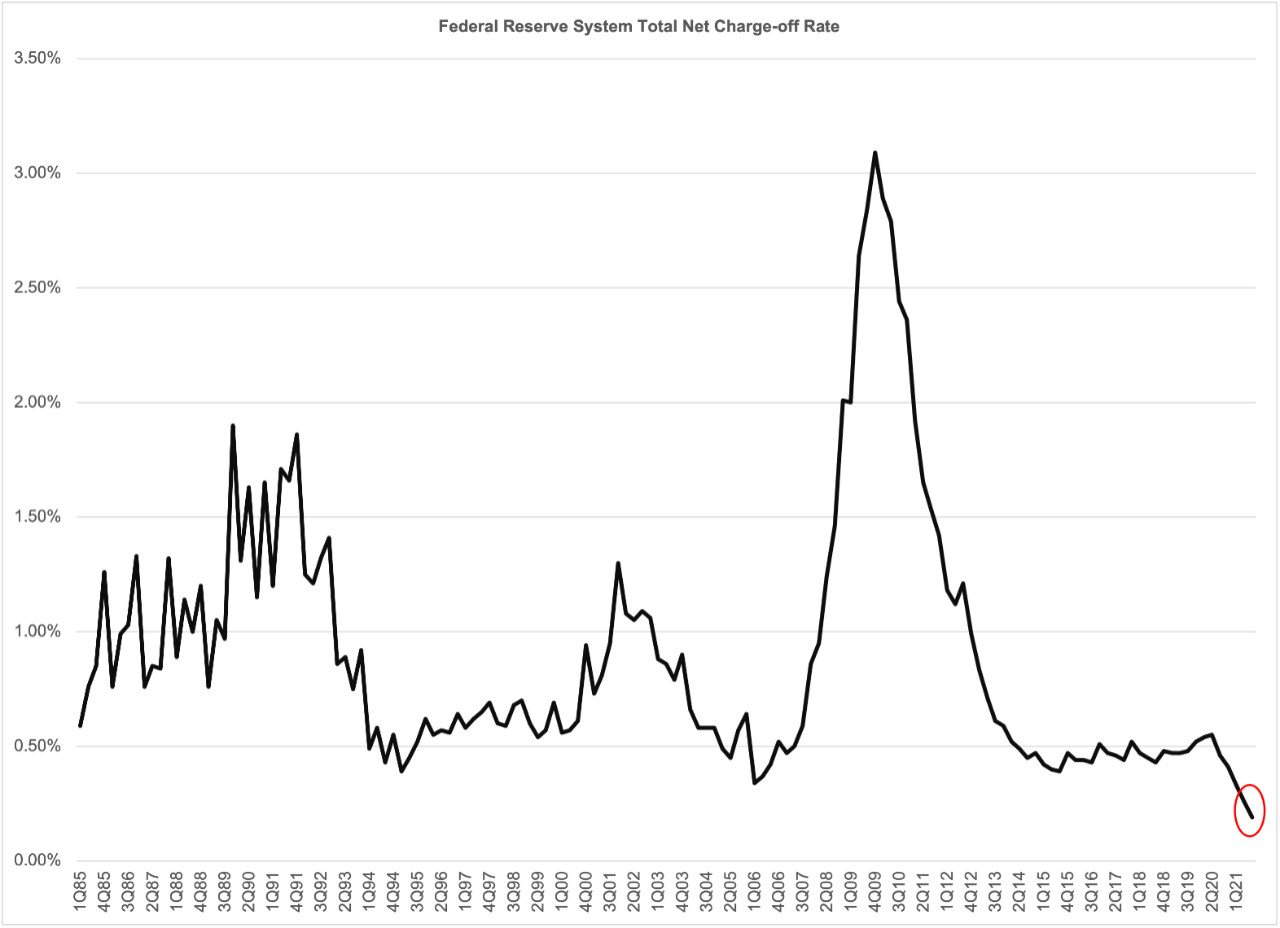
The most visible consequence of this allocation shift was downward migration in the system’s net interest margin (NIM), which combined with the massive increase in loan loss provisioning across the first two quarters of 2020 resulted in the worst earnings performance reported since the 2008 – 2009 recession. Fortunately, the anticipated wave of loan losses never materialized, with the net charge-off rate actually declining over the last 18 months. The reported measure at 0.19% for the third quarter of 2021 was the lowest level reported since the first quarter of 1985 and included net recoveries on residential mortgage loans, a 0.00% rate on agricultural production loans and a 1.67% loss rate on credit cards (vs. a 4.36% average over the same time span).
With stability in loan asset quality, the system was able to start releasing loss reserves beginning in the second half of 2020 to support earnings performance, although that reservoir was largely tapped in the first half of the current year. Fortuitously, demand for credit began to emerge as reserve releases began to fade, with total gross loan balances trending consistently higher after hitting bottom in April 2021.
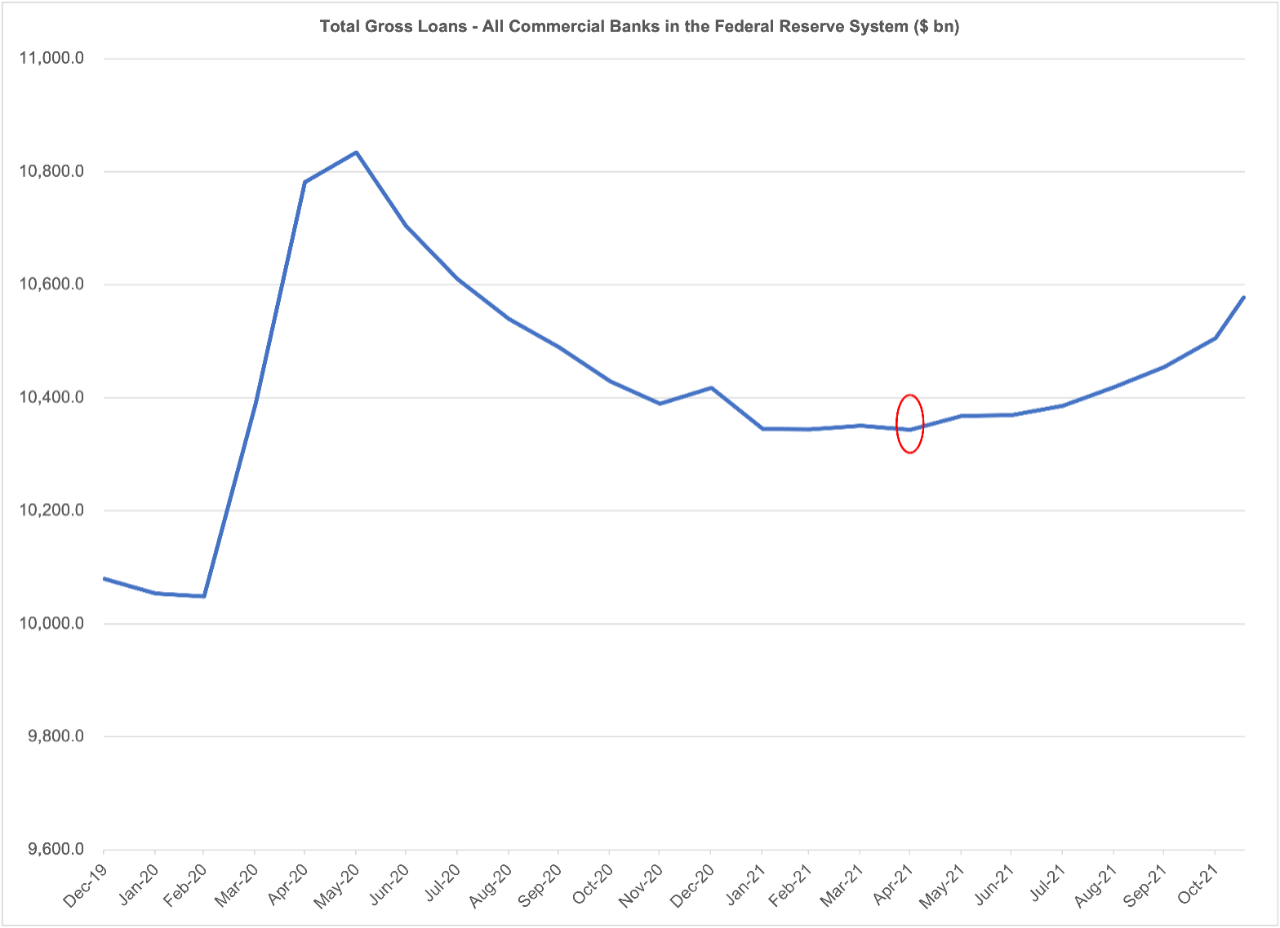
While the increase has been broadly driven by consumer demand for credit, most specifically to finance automobile purchases, attrition in C&I loan demand also appears to have bottomed out, with total balances increasing in seven of the last twelve reporting weeks. Coincidentally, consumers began to increase maintaining balances on credit cards, with the category accounting for $39.5 billion of the $76.2 billion increase (52%) in total non-mortgage consumer loans and 22% of the increase in total system loans since the 2021 midpoint.
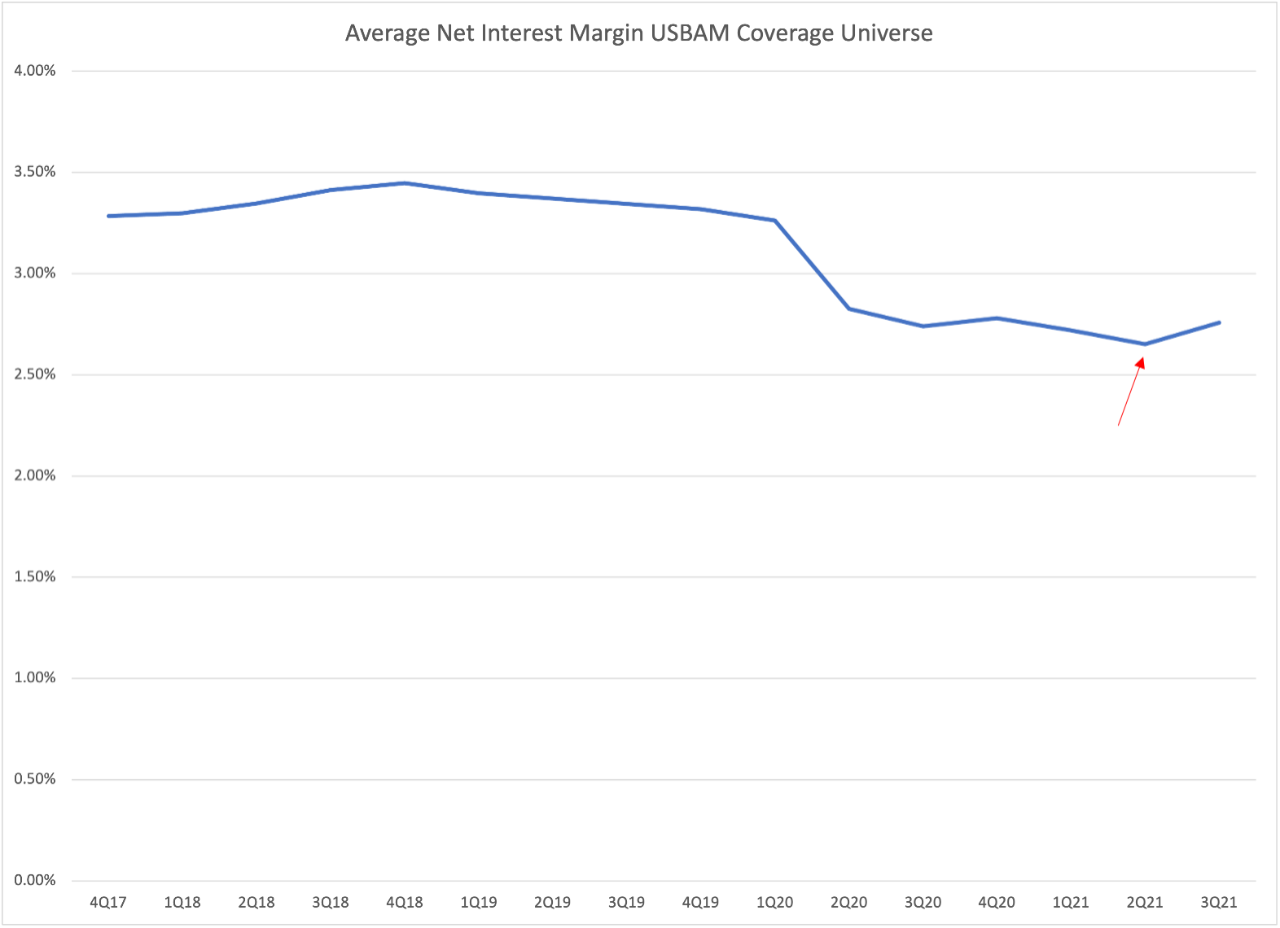
The data indicates that the lending drought is over, and growth in higher margin loan categories has visibly alleviated downward pressure on the system’s NIM. The average reported rate among our 20-bank domestic coverage universe hit its trough at 2.65% at the end of this year’s second quarter before widening to 2.76% at the end of the most recent quarter. Increasing demand for credit, trending in tandem with clean asset quality, bodes well for earnings performance over the coming year, reinforcing our positive bias to bank credit exposure moving forward.
Sources
Board of Governors of the Federal Reserve System, Statistical Release, H.8 Assets and Liabilities of Commercial Banks in the United States, November 26, 2021
Federal Reserve Bank, NCO Rates on Loans and Leases at Commercial Banks, November 22, 2021