Quarterly Portfolio Manager Commentary
December 31, 2023

Cash Management Portfolios
What market conditions had a direct impact on the bond market this quarter?
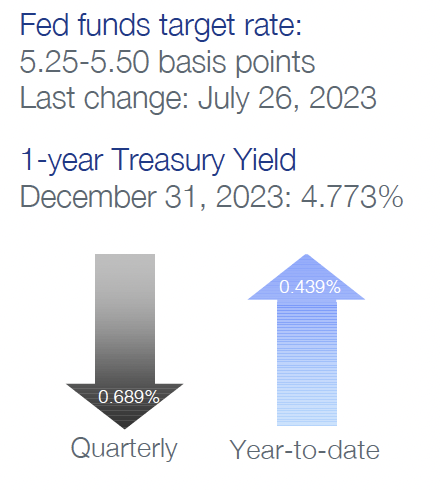
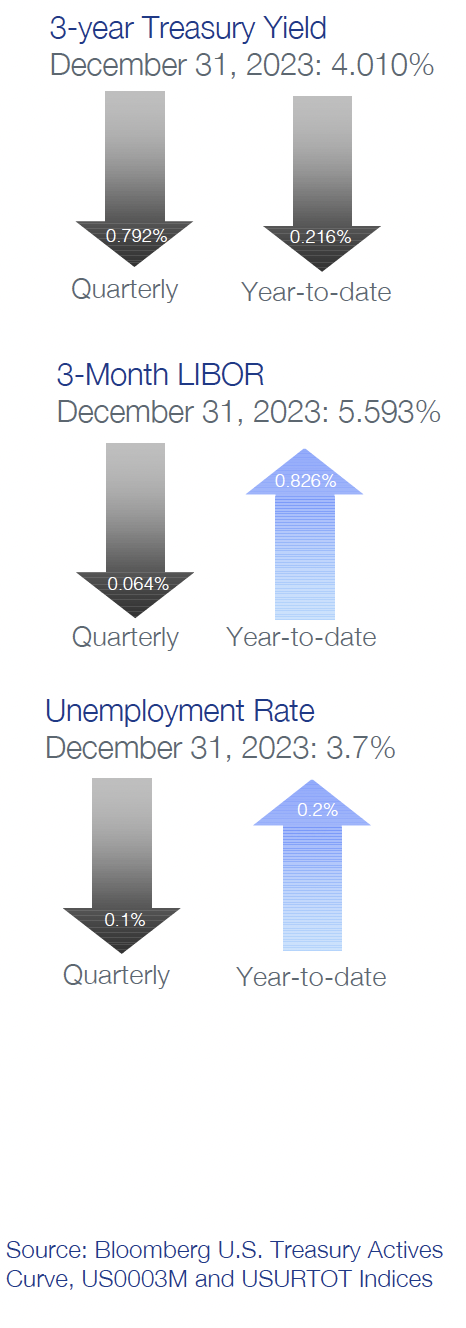
Economic Activity – Amid expectations for a sharp slowdown in growth, U.S. economic activity remained resilient, with fourth quarter (Q4) U.S. Gross Domestic Product (GDP) growth projected near 1.5% for the quarter. Personal consumption slowed throughout Q4 but stayed positive as U.S. households continue to benefit from moderating price pressures and solid job and income gains. The labor market continues its gradual rebalance with November U.S. job openings declining to 8.8 million open positions compared to 9.4 million at the end of Q3. Total unemployed workers in the labor force as of year-end was stable at 6.3 million. Monthly Non-farm Payrolls (NFP) growth further moderated, averaging 165,000 during Q4 with the U3 Unemployment Rate at 3.7% in December. Growth in Average Hourly Earnings is off its highs but still elevated at 4.1% year-over-year (YoY), emphasizing labor demand remains firm despite recent signs of easing. Headline inflation readings were lower on the quarter, reflecting declines in energy prices, with the Consumer Price Index (CPI) at 3.4% in December versus 3.7% in September. Core inflation continued its gradual downward trend with CPI ex. food and energy rising 3.9% YoY for December compared to 4.1% YoY in September. The Federal Reserve’s (Fed's) preferred inflation index – the PCE Core Deflator Index – increased 3.2% YoY for November. The recent trend of subdued inflation is promising and suggests price stability is within reach, but achieving sustainable 2% inflation will require further cooling of services prices.
Monetary Policy – The Fed elected to keep its target range for the federal funds rate unchanged at 5.25% to 5.50% at both the November 1 and December 13 meetings, as they continue to monitor incoming economic data and assess lagged impacts of prior rate increases. Maintaining the target range throughout the quarter was fully anticipated by the market, but the December meeting statement and press conference were viewed as dovish, with the Fed acknowledging progress on lowering inflation and noting rates are well into restrictive territory. The change in language signifies a policy pivot from the Fed’s prior restrictive stance and confirms the hiking cycle is complete. Despite this change, the Fed continued to implement its balance sheet reduction program (quantitative tightening (QT)), with a monthly cap of $60 billion in Treasury securities and $35 billion of agency mortgage-backed securities.
The Federal Open Market Committee (FOMC) released its updated Summary of Economic Projections at the December meeting. Revisions were modest; however, the most notable change was the median projection for the federal funds rate at the end of 2024, which was revised to a range of 4.5% to 4.75% compared to 5.0% to 5.25% following the September meeting.
The median dot now reflects 75 basis points (bps) of rate cuts in 2024 and 100 bps in 2025. The longer run dot was unchanged at 2.5%. The economic projections continue to suggest a growing consensus among the FOMC for an economic soft-landing and reflect a best-case scenario, implying inflation can decline toward the Fed’s 2% target without a meaningful slowdown in growth or deterioration in unemployment.
Fiscal Policy – Following a year in which fiscal spending was additive to U.S. GDP, recent legislative actions suggest government spending will have a modest dampening effect on economic growth in 2024. The debt ceiling agreement in mid-2023 keeps nondefense discretionary spending flat in 2024 while capping growth at 1% in 2025. With defense spending set to increase about 3% in 2024, these levels imply a reduction in real spending over the next two years. Further, Congress narrowly averted a government shutdown in November by passing a continuing resolution that extended government funding at current levels into the first quarter of 2024. While a recent agreement on overall discretionary spending levels consistent with the prior debt ceiling agreement provides hope for avoiding a shutdown, reaching a long-term funding deal remains challenging as congressional Republicans have voiced demands for further spending cuts this year.
Looking beyond the immediate concerns, the Infrastructure and Jobs Act (2021) and Inflation Reduction Act (2022) will boost government spending over the long-term, but near-term impacts are likely to be minor. On the municipal side, state and local government finances are starting to diverge with municipal entities more dependent on sales and property taxes faring better than those dependent on income taxes, but strong reserves have left the overall sector in a solid position if economic conditions weaken further.
Credit Markets – Yield curve levels plunged on market perception that the Fed has pivoted from higher-for-longer polices to 2024 rate cuts. Intra-month rate moves were even more severe than end-of-quarter point-to-point measures, with two-year yields ending the year almost 100 bps below the October 18 high of 5.224%. Despite QT and Fed policy rates reaching what are likely to be their peak for this cycle, financial conditions have eased considerably, reflected by December Bloomberg U.S. Financial Conditions Index readings indicating greater accommodation than at any point since the Fed started raising rates in March 2022. Elevated index yields to start the quarter combined with price appreciation from lower U.S. Treasury yields and tighter credit spreads to generate strong fixed income returns across all sectors. The bulk of these returns were concentrated in November and December.
Yield Curve Shift
|
U.S. Treasury Curve |
Yield Curve 9/30/2023 |
Yield Curve 12/31/2023 |
Change (bps) |
|---|---|---|---|
|
3 Month |
5.446% |
5.332% |
-11.4 |
|
1 Year |
5.448% |
4.762% |
-68.6 |
|
2 Year |
5.044% |
4.250% |
-79.4 |
|
3 Year |
4.799% |
4.009% |
-79.0 |
|
5 Year |
4.609% |
3.847% |
-76.2 |
|
10 Year |
4.571% |
3.879% |
-69.2 |
Duration Relative Performance
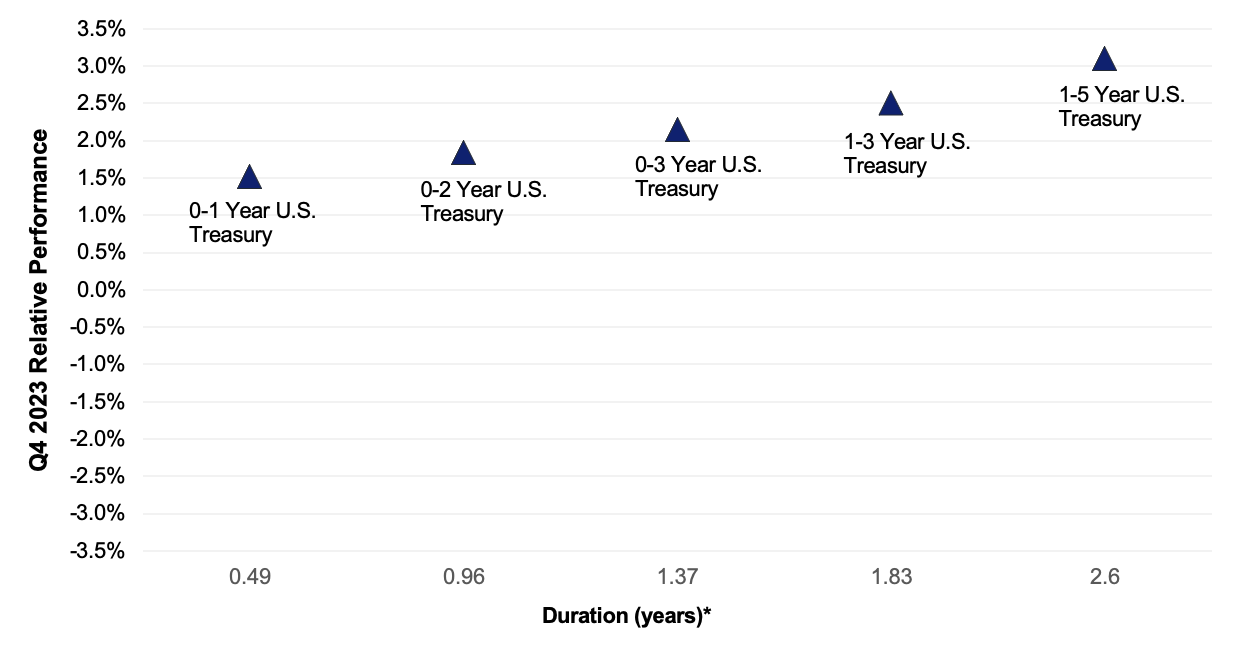
*Duration estimate is as of 12/31/2023
The significant fall in yield curve levels drove strong absolute returns for U.S. Treasuries with longer-duration Treasury indexes benefitting more than their shorter-duration peers. The three-month to five-year portion of the yield curve reversed recent trends and inverted 64.8 bps in the quarter. Increased U.S. Treasury issuance is beginning to strain markets, with most Treasury auctions seeing tepid demand compared to previous quarters and repo financing rates rising toward year-end.
Credit Spread Changes
|
ICE BofA Index |
OAS* (bps) 9/30/2023 |
OAS* (bps) 12/31/2023 |
Change (bps) |
|---|---|---|---|
|
1-3 Year U.S. Agency Index |
21 |
10 |
-11 |
|
1-3 Year AAA U.S. Corporate and Yankees |
16 |
10 |
-6 |
|
1-3 Year AA U.S. Corporate and Yankees |
40 |
34 |
-6 |
|
1-3 Year A U.S. Corporate and Yankees |
80 |
65 |
-15 |
|
1-3 Year BBB U.S. Corporate and Yankees |
109 |
97 |
-12 |
|
0-3 Year AAA U.S. Fixed-Rate ABS |
70 |
69 |
-1 |
Option-Adjusted Spread (OAS) measures the spread of a fixed-income instrument against the risk-free rate of return. U.S. Treasury securities generally represent the risk-free rate.
Falling yields and improved optimism for an economic soft landing bolstered risk assets in general and credit spreads specifically. Spreads on lower-rated issuers outperformed as their perceived greater vulnerability to a potential recession and to refinancing risk eased. Countering the trend, AAA-rated asset-backed securities (ABS) spreads were virtually unchanged in the quarter, likely due to deterioration in consumer debt performance for sub-prime and lower income borrowers. AAA ABS spreads ended the year slightly higher than single-A U.S. corporate debt.
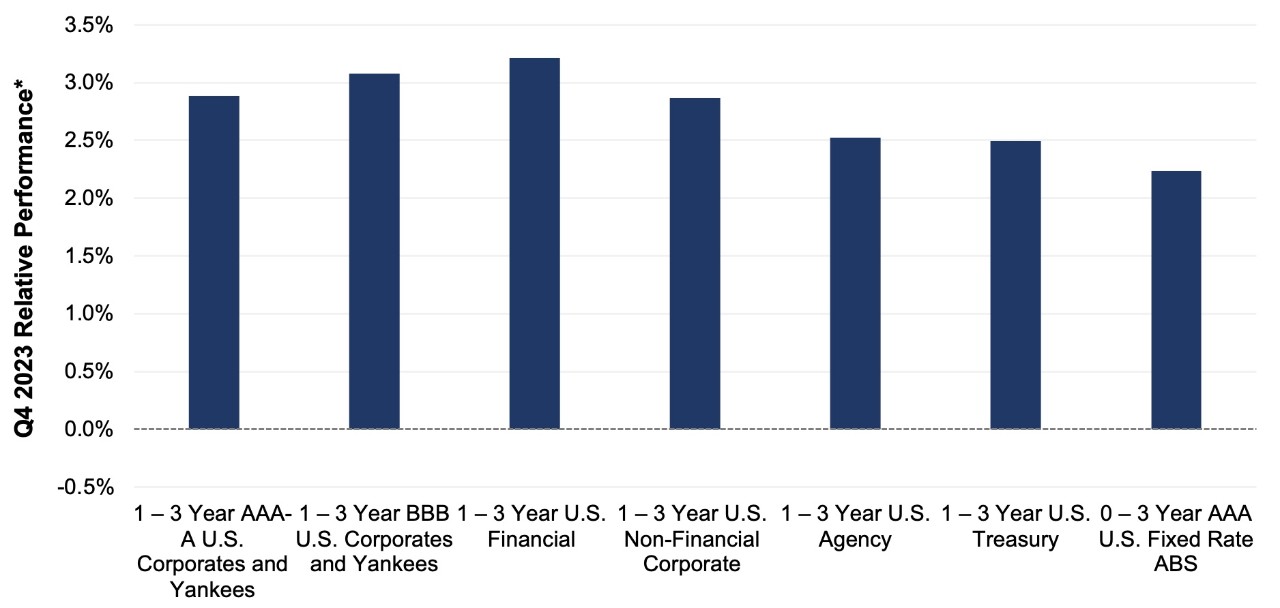
Credit Sector Relative Performance of ICE BofA Indexes
ICE BofA Index
*AAA-A Corporate index outperformed the Treasury index by 39.1 bps.
*AAA-A Corporate index underperformed the BBB Corporate index by 19.3 bps
*U.S. Financials outperformed U.S. Non-Financials by 35.0 bps
U.S. financials continued to outperform non-financial corporate debt as concerns over U.S. regional banks and overall bank funding waned. Further, the fall in yield curve levels likely improved unrealized loss positions on bank balance sheet securities.
What strategic moves were made and why?
Taxable Portfolios – Higher portfolio yields, a sharp decline in yield curve levels, and tighter credit spreads combined to generate significant positive fixed-income returns in the quarter. The primary driver of price returns was lower interest rates, and as expected, longer duration strategies outperformed their shorter duration counterparts. The bulk of fourth quarter performance occurred in November and December, after rates peaked in mid-to-late October. Demand for credit remained strong, with U.S. corporates outperforming Treasuries in the quarter, and BBB-rated corporates outperforming A-rated corporates. After a rocky first quarter of 2023, spreads on bank debt have steadily tightened with financials outperforming non-financials in the fourth quarter. There were no significant credit or rating events in the quarter, and no single issuer or position had a meaningfully negative impact on portfolio performance.
Tax Exempt and Tax-Efficient Portfolios – Our main objective entering the quarter was to better position accounts for a changing interest rate environment. While we didn’t necessarily view rate cuts as an imminent possibility, risks to multiple further rate hikes had receded. Repositioning included adding to fixed-rate allocations and extending portfolio durations. Municipal market conditions cooperated with these pursuits beginning in September, and we remained active buyers into October. Net supply was positive during this time and helped to improve relative valuations for short municipals versus comparable U.S. Treasury bonds. In fact, early in Q4, these relative ratios were near the cheapest levels for all of 2023, and absolute municipal yields were also at the peak. However, the investment climate changed drastically as rates fell precipitously throughout November. Our subsequent trading activity was minimal and limited to a few purchases of new issues, which traded at a significant spread to other high-grade alternatives.
How are you planning on positioning portfolios going forward?
Taxable Portfolios – From a rates perspective, several factors complicate portfolio duration and yield curve management. 1) There is considerable divergence between the Fed’s Dot Plot forecast and market expectations for rate cuts in 2024. The December Dot Plot is forecasting three rate cuts in 2024, but markets are pricing in significantly more accommodation, with year-end 2023 federal funds futures reflecting a 100% chance of a 25 bps rate cut in March and 150 bps of rate cuts by the end of 2024. We anticipate the Fed will hold policy rates steady at both the January 31 and March 20 meetings. And while we believe the Fed will cut rates later this year, 150 bps seems excessive. 2) The market is biased to take rates down, meaning the weight of evidence must convincingly be on the side of sustained or re-acceleration of growth or inflation to move yield curve levels higher. 3) Event risk is decidedly skewed toward the Fed cutting rates rather than raising. These factors lead us to believe we have seen peak rates in both the yield curve and Fed policy. As a result, the balance of risks suggests positioning portfolios to be more duration neutral by using intermittent pullbacks in yields to tactically extend portfolios. Despite tighter credit spreads, we will maintain an overweight to credit as improved prospects for a soft landing enhance the outlook for corporate credit quality, and in turn, the relative value of corporate credit spreads. While consumer credit metrics have deteriorated, particularly for sub-prime borrowers, we will continue to focus on well-structured prime auto, credit card and equipment loan AAA-rated ABS yielding comparable to single-A rated corporates.
Tax Exempt and Tax-Efficient Portfolios – We view the current market levels for tax-exempt debt as unattractive. The strong rally in municipal bond prices to close out 2023 is most likely unsustainable and may reverse to some extent in the coming months. We expect to see better opportunities as municipal supply and demand technical factors eventually become more favorable to buyers. In the meantime, we will be content to invest in short municipal variable rate demand notes (VRDNs) or stay in cash money market sweep vehicles. These investment options currently offer more than 50 bps in additional income versus buying a 3-year AAA-rated municipal bond. We are mindful that the overall economic and fixed income outlook is for lower yields during 2024. Although municipal specific market conditions can create some periodic obstacles to keeping portfolio durations extended, we plan to remain focused on keeping this metric near benchmark levels as we seek to maximize returns.
Sources
Bloomberg
https://www.wsj.com/politics/policy/congressional-negotiators-reach-agreement-on-1-6-trillion-government-spending-level-for-2024-c593a1b5?mod=policy_news_article_pos3
https://www.federalreserve.gov/monetarypolicy/files/fomcprojtabl20231213.pdf
https://www.federalreserve.gov/monetarypolicy/files/monetary20231213a1.pdf
https://www.federalreserve.gov/monetarypolicy/files/monetary20231101a1.pdf