Quarterly Portfolio Manager Commentary
December 31, 2025

Cash Management Portfolios
What market conditions had a direct impact on the bond market this quarter?
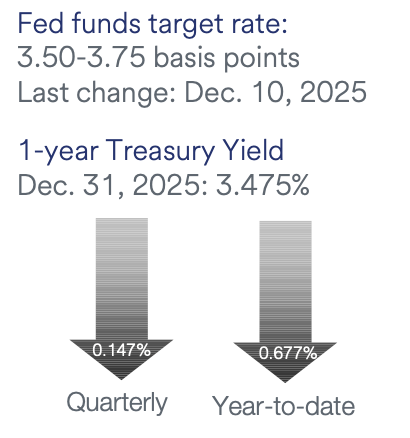
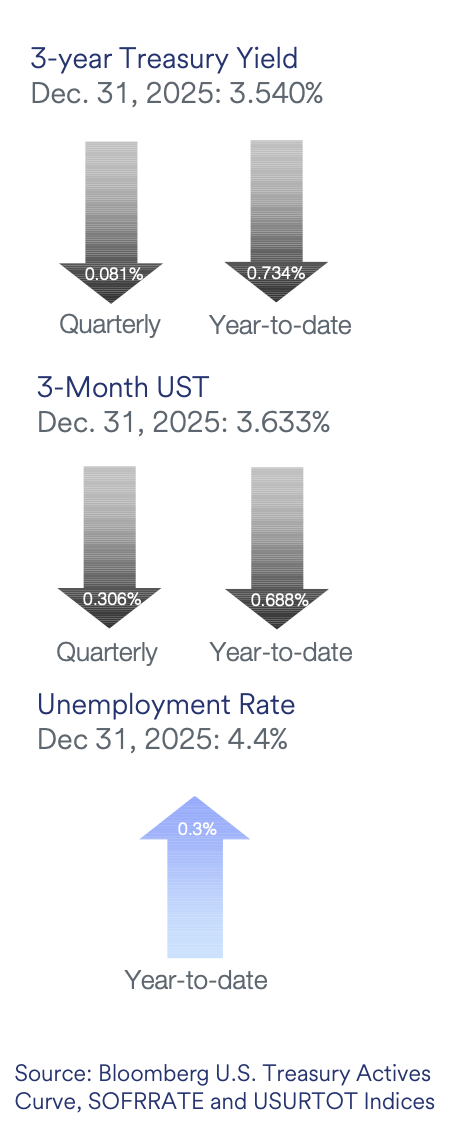
Economic Activity – The U.S. economy entered the fourth quarter of 2025 (Q4) in a strong position, with third quarter growth exceeding expectations on solid consumer spending and AI-driven business investment. However, economic activity in Q4 was disrupted by the federal government shutdown and its effects on data availability, creating uncertainty for much of the quarter. U.S. Gross Domestic Product (GDP) growth is projected to slow toward 1.5% in Q4, but negative effects from the shutdown should prove temporary and be recouped throughout the first quarter of 2026. Consumer confidence weakened amid shutdown concerns and labor market pessimism, particularly among lower-income households. Despite this decline in sentiment, consumer spending remained resilient through the holiday season, highlighting the ongoing disconnect between sentiment and actual activity. Employment conditions continued to cool, reflecting weak labor demand as businesses maintained a low-hire/low-fire strategy. U.S. job openings remained volatile month to month, yet the broader downward trend persisted in Q4, with November openings at 7.1 million versus 7.5 million total unemployed workers in December. Monthly Nonfarm Payrolls (NFP) growth remained subdued, averaging 14,500 in the second half of 2025, and overall payrolls contracted in Q4 due to federal workforce reductions. The unemployment rate held at 4.4%, supported by low layoffs and slower labor force growth. Average hourly earnings continued to show strength, rising 3.8% year-over-year (YoY) in December. Inflation eased, with headline Consumer Price Index (CPI) declining to 2.7% in December and core CPI (excluding food and energy) rising 2.6% YoY for December. However, data disruptions from the shutdown raise accuracy concerns. Confirmation is needed to validate disinflation, as tariffs and expansionary fiscal policy pose upside risks, making near-term progress toward the Fed’s 2% target unlikely.
Monetary Policy – The Fed continued its easing cycle in Q4, lowering the federal funds target range by 25 basis points (bps) in both October and December, ending the year at 3.50% to 3.75%. The December decision drew three dissents—the most since 2019. Kansas City Fed President Schmid and Chicago Fed President Goolsbee favored no change to the target range, while Governor Miran preferred a 50 bps reduction. The Fed revised its December post-meeting statement to note that “the extent and timing of additional adjustments” will depend on the incoming data and economic outlook. This change in language suggests a more patient approach to easing, with consensus expectations pointing to a pause at the upcoming January meeting. Additionally, the Fed announced plans to begin reserve management purchases (RMPs) of Treasury bills to maintain reserves at an “ample level.” Initial RMPs are expected to total approximately $40 billion per month, tapering to $20-$25 billion per month over time.
The December Summary of Economic Projections kept the “dot plot” unchanged, showing 25 bps cuts in 2026 and 2027. However, individual projections remain widely dispersed, underscoring division among Federal Open Market Committee (FOMC) members regarding the future path of policy rates. The estimated longer-run neutral rate was unchanged at 3.0%. Median forecasts now call for stronger GDP growth, lower inflation, and reduced unemployment—assumptions that appear inconsistent with labor market risks and a lower rate outlook.
Fiscal Policy – Fiscal policy remained expansionary in the fourth quarter, despite the quarter beginning with the longest government shutdown in U.S. history (43 days). Legislative measures and government spending continued to support growth, including passage of the One, Big, Beautiful Bill (OBBB) Act earlier in the year. Among other provisions, the Act permanently extends the 2017 tax cuts, increases defense spending, and introduces growth-friendly measures such as immediate deduction of capital expenses for businesses—steps expected to boost investment and provide an economic tailwind. Legislation to end the shutdown included a continuing resolution to fund the government at current levels through January 2026, while providing full-year funding for the Agriculture Department, military construction, and the legislative branch.
Looking ahead to the upcoming midterm elections, we anticipate additional accommodative fiscal policy measures in 2026. However, the landscape is not without challenges, including legal questions surrounding tariffs imposed under the International Emergency Economic Powers Act (IEEPA) and the risk of another government shutdown. In November, the U.S. Supreme Court heard oral arguments on the Administration’s use of IEEPA to implement tariffs. While legal experts predict a ruling against the Administration, tariffs are likely to remain in some form given their prominence in the Administration’s agenda. Additionally, the funding deal that reopened the government in November expires at the end of January, leaving Congress less than one month to pass spending legislation or risk another shutdown. On the municipal front, the sector faces growing financial pressures from increased local funding needs, the exhaustion of federal pandemic aid, and economic uncertainties related to tariffs. Municipalities enter this period from a position of relative strength, however, as solid revenues and robust reserves provide the flexibility needed to navigate these headwinds.
Credit Markets – Financial markets navigated several headwinds in the fourth quarter, including persistent inflationary pressures, weakening labor market data, and the longest government shutdown in U.S. history, lasting 43 days. Despite these challenges—and already stretched valuations—risk assets remained resilient. Multiple Federal Reserve rate cuts, along with generally positive expectations for economic growth in 2026, supported investor sentiment.
Investment-grade credit spreads experienced only modest widening and remained near multi-year lows. The pace of new investment-grade corporate bond issuance slowed somewhat during the quarter following a particularly strong September. Supply continues to be well received, secondary market liquidity remains solid, and there was no meaningful deterioration in the credit quality of held positions..
Yield Curve Shift
|
U.S. Treasury Curve |
Yield Curve 9/30/2025 |
Yield Curve 12/31/2025 |
Change (bps) |
|---|---|---|---|
|
3 Month |
3.932% |
3.633% |
-29.9 |
|
1 Year |
3.614% |
3.475% |
-13.9 |
|
2 Year |
3.608% |
3.475% |
-13.3 |
|
3 Year |
3.619% |
3.540% |
-7.9 |
|
5 Year |
3.741% |
3.726% |
-1.5 |
|
10 Year |
4.150% |
4.169% |
1.9 |
Duration Relative Performance
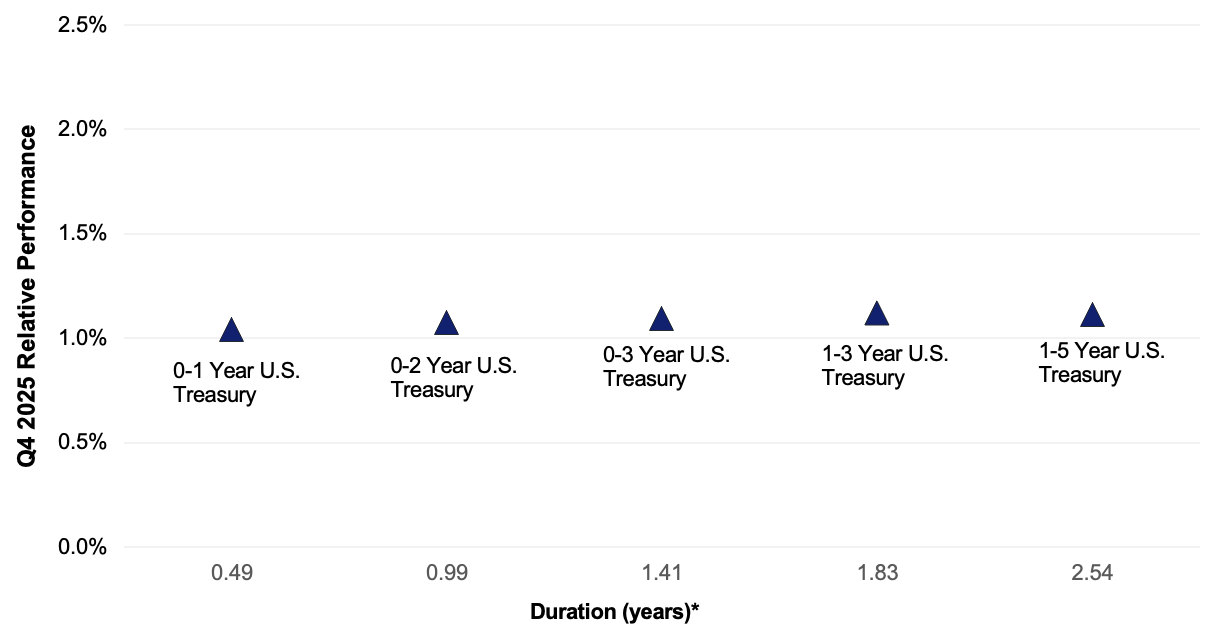
*Duration estimate is as of 12/31/2025
Duration positioning, like the third quarter, did not meaningfully influence the performance of short duration mandates. Treasury indices with durations ranging from 0.5 to 2.5 years delivered returns within a narrow range over the period. Yields on front end maturities (1–3 years) declined as markets priced in additional Federal Reserve rate cuts, while yields in the intermediate segment of the curve (5–10 years) remained relatively stable. This steepening bias is expected to continue through 2026 based on current consensus forecasts. However, the anticipated shifts are projected to be more muted than the approximately 40 bps move between the 2 year and 10 year segments observed in 2025.
Credit Spread Changes
|
ICE BofA Index |
OAS* (bps) 9/30/2025 |
OAS* (bps) 12/31/2025 |
Change (bps) |
|---|---|---|---|
|
1-3 Year U.S. Agency Index |
1 |
1 |
0 |
|
1-3 Year AAA U.S. Corporate and Yankees |
5 |
7 |
2 |
|
1-3 Year AA U.S. Corporate and Yankees |
23 |
25 |
2 |
|
1-3 Year A U.S. Corporate and Yankees |
40 |
44 |
4 |
|
1-3 Year BBB U.S. Corporate and Yankees |
66 |
71 |
5 |
|
0-3 Year AAA U.S. Fixed-Rate ABS |
41 |
50 |
9 |
Option-Adjusted Spread (OAS) measures the spread of a fixed-income instrument against the risk-free rate of return. U.S. Treasury securities generally represent the risk-free rate.
Investment-grade corporate credit spreads experienced only modest widening in Q4 and remained near multi year lows. These levels reflect strong corporate fundamentals and a constructive outlook for economic activity heading into 2026. Supply is expected to be elevated over the coming year, with some strategists projecting more than $2 trillion in new issuance. This could create periods of short term pressure but may also lead to more attractive valuations.
Credit Sector Relative Performance of ICE BofA Indexes
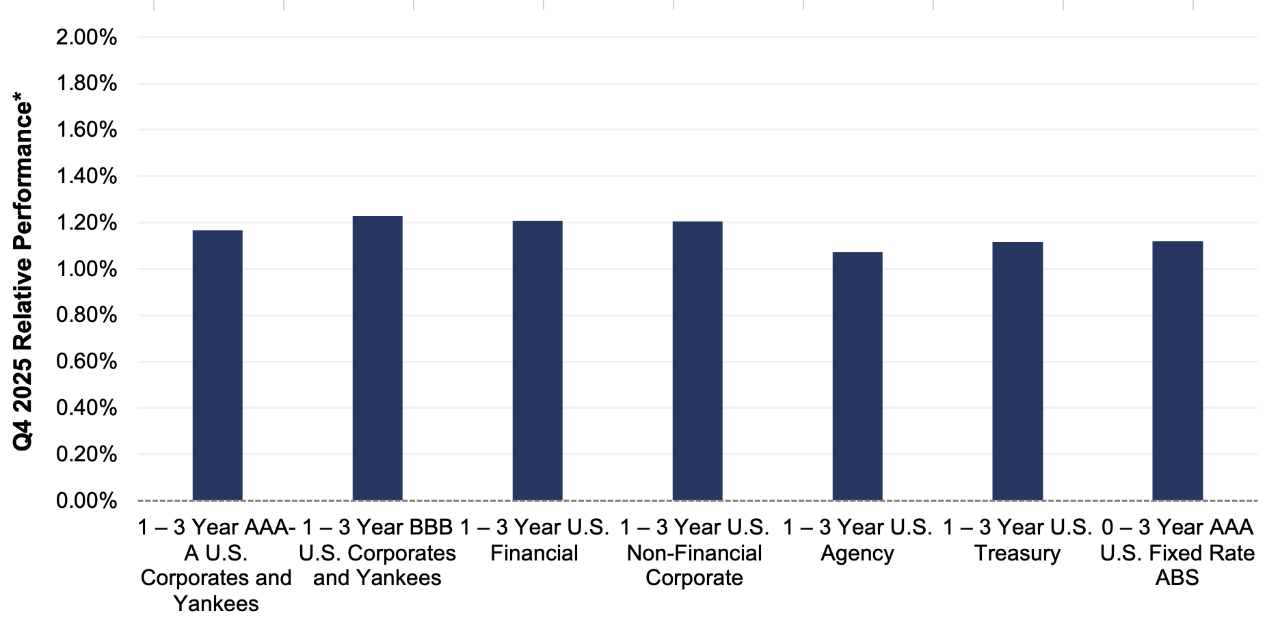
ICE BofA Index
*AAA-A Corporate index outperformed the Treasury index by 4.9 bps.
*AAA-A Corporate index underperformed the BBB Corporate index by 6.2 bps
*U.S. Financials outperformed U.S. Non-Financials by 0.4 bps
Credit portfolios continued to outperform Treasurys, despite the modest widening noted earlier. This outperformance primarily reflects the additional spread and income advantages associated with corporate securities. Although lower-rated investments delivered slightly stronger returns again this quarter, the incremental benefit is not particularly compelling on a risk adjusted basis.
What strategic moves were made and why?
Taxable Portfolios – The Federal Reserve maintained an easing bias in Q4, delivering an additional 50 bps of rate cuts. Front-end yields traded within a narrow 20 bps range as markets continued to recalibrate expectations for near-term and 2026 monetary policy. The 2-year Treasury—highly sensitive to Fed direction—ended the quarter 13 bps below September levels and within 5 bps of multiyear lows. Portfolio returns were solid, and duration positioning—consistent with Q3—had limited impact on relative performance. Treasury indices with durations between 0.5 and 2.5 years delivered returns that were tightly clustered within roughly 7 bps. Credit allocations again contributed positively, despite modest spread widening in November. Corporate supply slowed meaningfully into year end, with December issuance of $35 billion marking the lowest monthly volume of 2025. Full year supply reached $1.7 trillion, a 10% increase versus 2024 and the highest annual issuance outside of the 2020 pandemic related surge. Investor demand remained strong throughout the year, and spreads stayed near historically tight levels. There were no notable credit or rating events, and no single issuer or position meaningfully influenced performance.
Tax Exempt and Tax-Efficient Portfolios – The municipal yield curve flattened significantly in early Q4, with the 2-year to 10-year segment narrowing by 35 bps in October. Short-maturity yields rose roughly 15 bps, while 10-year yields declined nearly 20 bps. This occurred despite one of the year’s weakest technical backdrops, characterized by approximately $22 billion in positive net supply. However, long-duration municipal funds and ETFs continued to experience strong inflows. During this period, we extended duration, anticipating that front-end weakness would be temporary—a view that proved accurate as shorter-maturity yields subsequently fell. Throughout the quarter, we closely monitored duration relative to benchmarks and made selective additions late in the period to move positioning closer to neutral. Valuations remained attractive, particularly with 2-year municipal-to-Treasury ratios near 70%.
How are you planning on positioning portfolios going forward?
Taxable Portfolios – Multiple Fed rate cuts still appear likely in 2026, though the first move may not occur until mid-year. A new Federal Reserve Chair is expected to be appointed in the coming weeks and is likely to support rate reductions in the second half of the year. As a result, duration positioning should remain close to benchmarks. Strategists are projecting potentially record IG corporate issuance in 2026, with estimates exceeding $2 trillion. Maintaining capacity to add corporates during periods of weakness remains prudent, particularly with spreads near historically tight levels. Our focus will remain on reducing credit duration and emphasizing higher quality issuers. The slight Q4 outperformance (6 bps) of the 1–3 Year BBB U.S. Corporates and Yankees Index relative to the 1–3 Year AAA–A Index is not compelling on a risk-adjusted basis. Security selection will continue to be central to identifying relative value opportunities. ABS remains a favored allocation given attractive spreads relative to AAA–AA corporates and strong fundamentals among prime borrowers. However, the recently proposed caps on credit card interest rates may warrant a temporary pause in additional allocations, allowing flexibility to add exposure should spreads widen.
Tax Exempt and Tax-Efficient Portfolios – The municipal market enters 2026 after a second consecutive year of record issuance, with more than $580 billion raised across tax-exempt and taxable municipal structures—surpassing 2024 by approximately $67 billion. Strategists anticipate another strong year ahead, with estimates ranging from $520 billion to over $750 billion. As usual, issuance is expected to build gradually. In the meantime, we anticipate seasonal technical strength, supported by elevated January reinvestment demand, which may initially push yields lower. Conditions could become more favorable for buyers by March. Our current duration stance provides flexibility to deploy capital patiently at more attractive levels. If duration diverges meaningfully from benchmarks, we will prioritize security selection to optimize yields. For eligible mandates, taxable municipals remain a compelling option, as after-tax yields exceed those of traditional municipals.
Sources
Bloomberg
https://www.federalreserve.gov/monetarypolicy/files/monetary20251210a1.pdf
https://www.federalreserve.gov/monetarypolicy/files/fomcprojtabl20251210.pdf
https://www.wsj.com/politics/policy/house-spending-bill-government-shutdown-05bf3a6e?mod=hp_lead_pos2
https://www.cnbc.com/2026/01/09/trump-will-use-other-tariff-authorities-to-get-to-same-place-if-supreme-court-rules-against-him-hassett.html