Quarterly Portfolio Manager Commentary
June 30, 2025

Cash Management Portfolios
What market conditions had a direct impact on the bond market this quarter?
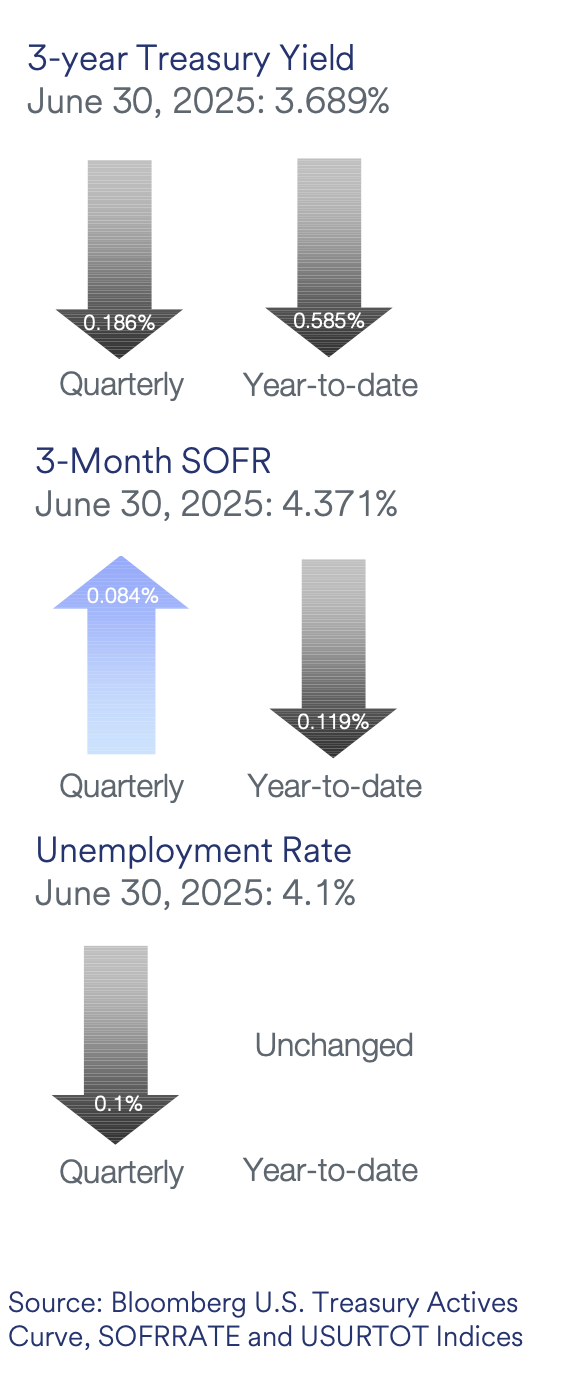
Economic Activity – U.S. economic growth during the second quarter of 2025 (Q2) was characterized by slower activity and growing uncertainty as the economy reacted to the volatile rollout of trade tariffs and rising geopolitical tensions. U.S. Gross Domestic Product (GDP) is projected to grow near 2.0% for Q2. This follows a 0.5% contraction in the first quarter due to one-off trade deficit effects. Growth is projected to slow over the remainder of the year, however, as persistent trade policy uncertainty and expectations for higher inflation drive cautious behavior from consumers and businesses. Personal consumption slowed during the quarter, reflecting declining confidence and payback from earlier tariff front-running. Labor markets remained resilient with solid hiring activity and low layoffs, but cracks in underlying data are starting to show including rising continuing jobless claims, slowing wage growth, and reduced breadth of hiring. Month-to-month U.S. job openings continue to be volatile with May openings rising to 7.8 million open positions while the total number of unemployed workers in the labor force as of June remained stable at 7.0 million. Monthly Nonfarm Payrolls (NFP) growth remains healthy, averaging 150,000 during Q2 and the U3 Unemployment Rate was 4.1% in June. Average Hourly Earnings growth slowed to 3.7% year-over-year (YoY) but continues to be above pre-pandemic levels. U.S. inflation readings remained above the Federal Reserve’s (Fed) 2% target in Q2 with the Consumer Price Index (CPI) stable at 2.4% in May as lower energy prices offset modest increases in food and core services prices. Core inflation was also stable with CPI ex. food and energy rising 2.8% YoY for May and the Fed’s preferred inflation index – the PCE Core Deflator Index – increasing 2.7% YoY. Excess inventories and softer demand have thus far limited upward price pressures, but inflation is projected to increase in the second half of the year as tariff-related costs begin to emerge. However, the timing, extent, and duration of these pressures are unknown.
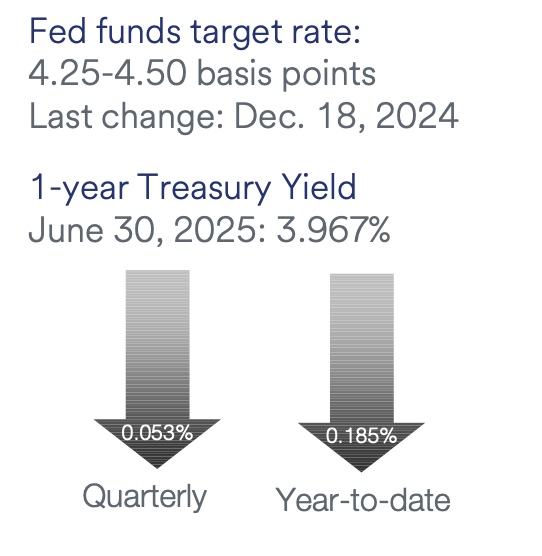
Monetary Policy – The Fed left its federal funds target range unchanged during the quarter at 4.25% to 4.50%. The Fed’s post-meeting statement was little changed while noting uncertainty has “diminished but remains elevated.” With current policy well-positioned to respond to material changes in the outlook, Fed Chair Powell continues to stress patience as the Committee awaits more clarity surrounding the impact tariffs will have on growth and inflation. Additionally, the Fed maintained the pace of its balance sheet reduction program (quantitative tightening) with a monthly cap on Treasury securities of $5 billion and on agency mortgage-backed securities of $35 billion.
The Federal Open Market Committee (FOMC) released its updated Summary of Economic Projections at the June meeting. The FOMC’s “dot plot” continues to suggest 50 basis points (bps) in rate cuts by the end of 2025 (target range of 3.75% to 4.0%), although there is a divergence of views as eight members are calling for two rate cuts in 2025 and seven are calling for none. The median dots show further rate cuts of 25 bps in 2026 (previously 50 bps) and 25 bps in 2027 (unchanged), and the estimated longer-run neutral rate was unchanged at 3.0%. The FOMC’s economic projections were revised to show higher expected core inflation and a higher unemployment rate in 2025-2027 with a lower GDP growth forecast for 2025-2026 compared to the prior release.
Fiscal Policy – The whirlwind of fiscal policy action beginning in Q1 extended through Q2, with the quarter starting with a steady stream of tariff announcements and closing with the passage of the sweeping One Big Beautiful Bill Act. The Trump Administration’s “Liberation Day” tariff announcement on April 2 included a baseline 10% tariff on all imports and “reciprocal” tariffs on dozens of countries that have trade deficits with U.S. Reciprocal tariffs were paused for 90 days (deadline subsequently extended to August 1) as the Administration continues to work on individual trade deals. As of this writing, the U.K. and Vietnam are the only countries with trade deals in place. Additional tariffs have also been placed on steel and aluminum, automotives, and non-USMCA-compliant goods from Canada and Mexico and further sectoral tariffs are expected over the near-term including semiconductor chips and pharmaceuticals. The tariff situation remains fluid, but implementation of expansive tariff policies will serve as an economic headwind moving forward.
The other fiscal highlight was passage of the One Big Beautiful Bill Act on July 4. Among other things, the Act permanently extends the 2017 tax cuts, boosts spending for defense, immigration, and border control, and raises the debt limit by $5 trillion. The Act also includes spending cuts to Medicaid and clean-energy tax credits and subsidies. Passage of the Act should provide a modest boost to economic growth next year and removes debt ceiling risk for a couple of years. After addressing the debt ceiling and renewing the 2017 tax cuts, Congress’ remaining key deadline for the year will be to pass a government funding bill by September 30. On the municipal front, the sector is facing growing headwinds to finances including rising demand for local funding, evaporation of Federal covid money, and unknown impacts from tariffs on economic activity. Fortunately, municipal revenues have remained solid to this point and reserves remain strong.
Credit Markets – The second quarter got off to a rocky start on the heels of the Trump Administration’s Liberation Day tariff announcement on April 2. Credit spreads widened and treasury yields fell in reaction to the more severe than expected proposals. Further uncertainty was introduced when Israel attacked Iranian nuclear capabilities, sending oil prices higher and creating concerns over a potential wider regional conflict. Credit markets and spreads recovered from their peaks as the Trump administration paused the implementation of certain tariffs until July 9 and new trade deals were negotiated, easing concerns over worst-case economic scenarios. While new issuance was restrained in the first part of the quarter, fixed income markets for the most part continued to function properly with solid liquidity and no meaningful deterioration in the credit quality of held positions.
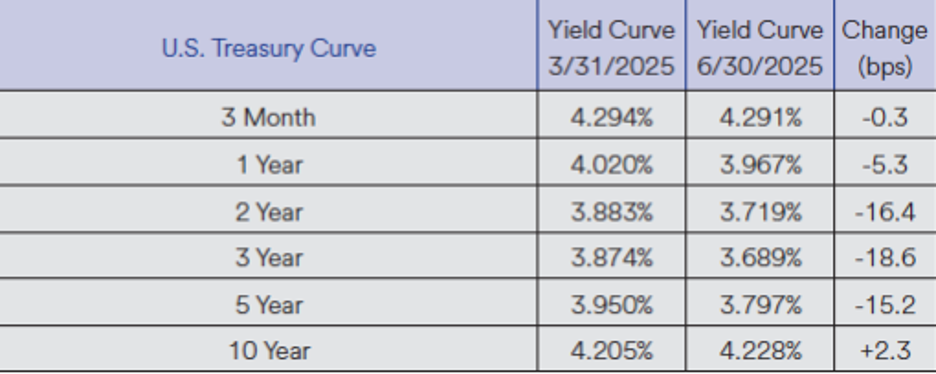
Yield Curve Shift
Duration Relative Performance
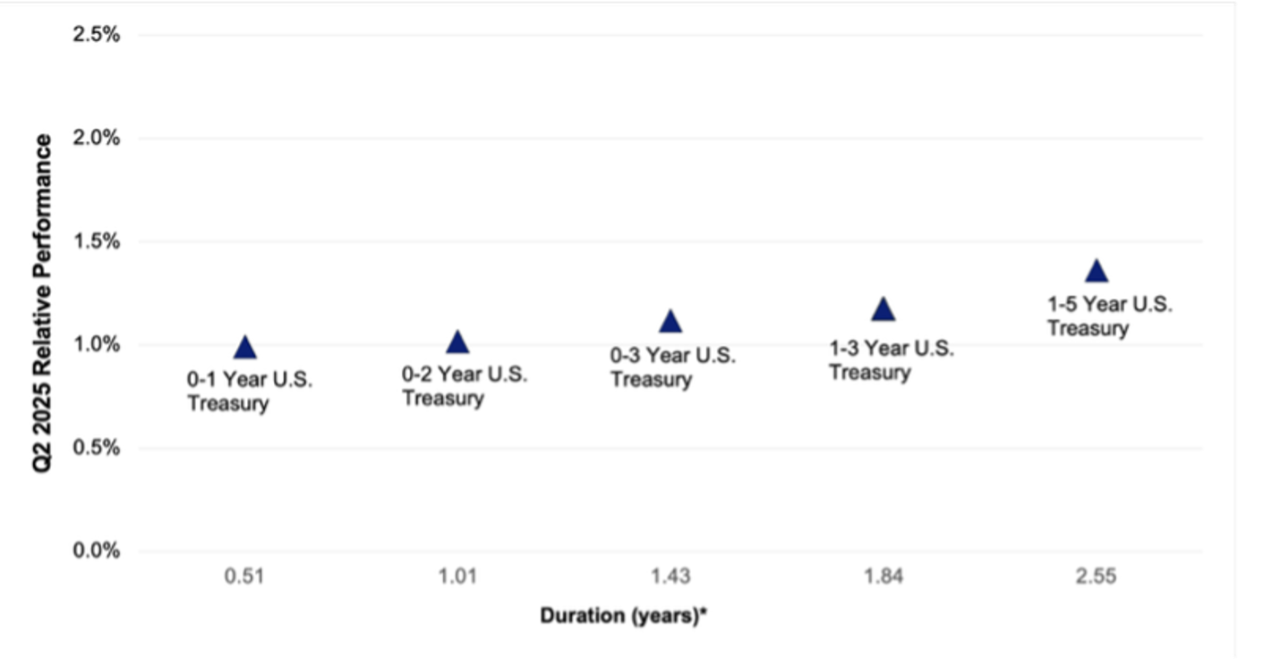
*Duration estimate is as of 6/30/2025
Falling yields contributed to the quarter’s strong fixed income returns. The three-month to 10-year portion remained inverted, with front-end yields remaining stable on no Fed policy changes in the quarter and 10-year yields only rising 2.3 bps. With two to five-year yields falling more than short-term yields, longer duration strategies outperformed short duration strategies. There was some volatility along the front-end of the yield curve, with two-year yields trading within a range of 3.60% and 4.05% in the quarter, presenting some tactical opportunities to position portfolio duration.
Credit Spread Changes
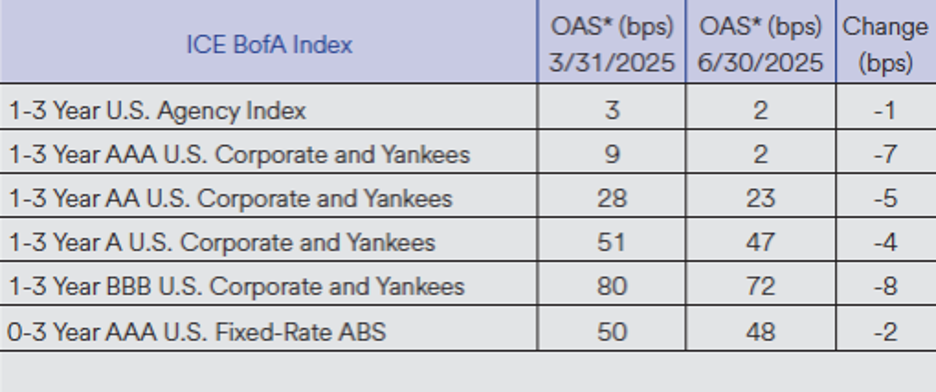
Corporate credit spreads tightened in the quarter, more than recovering from the April 2 tariff announcement-induced spread widening. Credit spreads are relatively tight from a historical basis. Spread performance in the ABS sector was more muted than in the corporate sector, leading to underperformance versus investment-grade corporates.
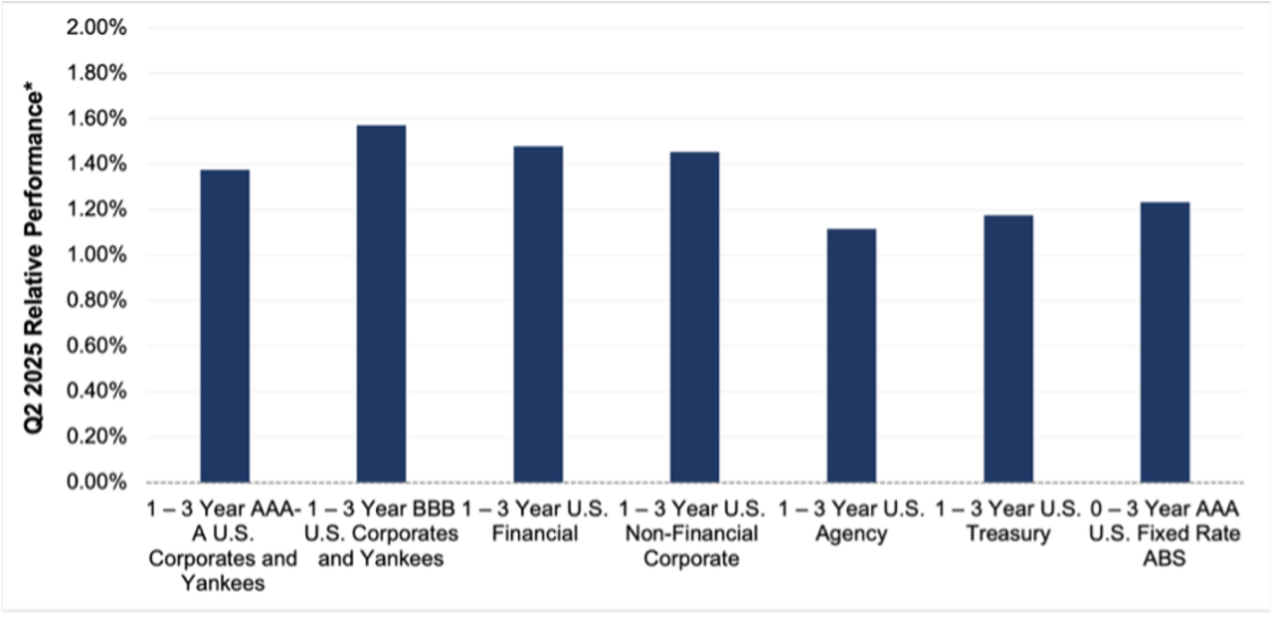
Credit Sector Relative Performance of ICE BofA Indexes
ICE BofA Index
*AAA-A Corporate index outperformed the Treasury index by 20.0 bps.
*AAA-A Corporate index outperformed the BBB Corporate index by 19.6 bps
*U.S. Financials outperformed U.S. Non-Financials by 2.7 bps
Declining treasury yield curve levels and tightening credit spreads across the investment-grade universe generated strong absolute performance for all fixed income sectors. Down-in-credit outperforming higher-rated credit was a general theme, highlighted by the BBB corporate index’s 19.6 bps outperformance of the AAA-A corporate index.
What strategic moves were made and why?
Taxable Portfolios – Lower yield curve levels and tighter credit spreads drove solid fixed income returns in the quarter. Strong investor demand for yield helped corporate credit solidly outperform comparable duration treasuries via a combination of coupon income advantage and price appreciation from tighter credit spreads. Down in investment-grade credit was a winning strategy in the quarter, highlighted by the BBB corporate debt index outperforming A-rated and better corporates by a healthy 19.6 bps. Asset-Backed Securities (ABS) were a bit of an outlier, mildly outperforming treasuries but lagging corporate credit. The three-month to five-year portion of the yield curve inverted by 14.9 bps in the quarter, leading to outperformance for longer versus shorter strategies. Despite the elevated level of rate and spread volatility immediately following the Administration’s tariff roll-out on April 2, financial markets continued to function properly with minimal impact to general market liquidity. There were no significant credit or rating events in the quarter, and no single issuer or position had a meaningfully positive or negative impact on portfolio performance.
Tax Exempt and Tax-Efficient Portfolios – Macroeconomic conditions and tariff-induced volatility collided with a municipal market that was also experiencing some seasonal imbalances in supply/demand. This occurrence resulted in elevated levels of interest rate movements during April. Short municipal bond yields saw intraday shifts of more than 25 bps for several days, and relative ratios for municipals versus comparable maturity treasuries approached 90% at the extremes. We prudently extended portfolio durations during this liquidity driven event. This strategy proved to be opportunistic as market valuations would improve later in the quarter. New issuance remained robust in Q2. The month of June, in particular, made headlines with more than $54 billion in new sales – the second highest month of tax-exempt volume ever. This supply has been a headwind at times, and provided for more attractive levels for new purchases.
How are you planning on positioning portfolios going forward?
Taxable Portfolios – With equity markets near all-time highs and corporate credit spreads near historical tights, financial markets appear to be priced for perfection with little margin for error. That said, several potential risks have been negated recently. Passage of the One Big Beautiful Bill Act on July 4th among other things, permanently extended the 2017 tax cuts, boosted spending, and raised the debt limit by $5 trillion, eliminating the near-term risk of market disruption from a potential technical default on U.S. treasuries. Investors should expect continued uncertainty from tariff and trade related headlines, but progress is being made on several fronts including deals with key trading partners such as Japan and the U.K. With stretched spread valuations entering the quarter, incremental returns from further spread compression appear less likely. As such, an emphasis will be placed on security selection and new issue opportunities to find pockets of value. For the quarter, our outlook is for marginally lower yield curve levels out to five years as we anticipate the Fed will cut rates one or two times in the latter half of 2025. We anticipate portfolio duration positioning will be primarily neutral to benchmark duration, but with a focus on ensuring portfolios do not passively get short given risks are skewed to lower rather than higher rates. Elevated T-bill issuance to rebuild the Treasury’s General Account post debt ceiling limitations should push short rates higher, creating opportunities on the very front-end of the yield curve to capture incremental yield and income.
Tax Exempt and Tax-Efficient Portfolios - Our strategies for the coming months will incorporate both our views for Fed policy, as well as municipal market specific factors tied to reinvestment demand and new issue supply. Currently, we are content with a slightly short to neutral positioning versus benchmarks. Our expectation is that municipal relative value may improve again in the September/October area, at which time our bias may shift to neutral/slightly long. We are mindful and determined that portfolios not be allowed to drift too short versus benchmarks. Thus, some tactical/defensive purchases may still likely be required in the next couple months. In previous commentary we mentioned some market concerns surrounding tax policy, and the possibility municipal bonds might lose their tax-exempt status on a go-forward basis. The One Big Beautiful Bill has now been signed, sealed, and delivered; with no changes to the exemption.
Sources
Bloomberg
https://www.federalreserve.gov/monetarypolicy/files/monetary20250507a1.pdf
https://www.federalreserve.gov/monetarypolicy/files/monetary20250618a1.pdf
https://www.federalreserve.gov/monetarypolicy/files/fomcprojtabl20250618.pdf
https://economics.bmo.com/en/publications/detail/56a75a45-fbc2-49b6-9fd3-0fd5426af907/
https://www.npr.org/2025/07/09/nx-s1-5460936/trump-tariffs-economy-china-policy