Winter Solstice
December 21, 2023

Rob Hajduch, Managing Director, Taxable Credit Research
The winter solstice is an astronomical phenomenon when the Earth’s poles reach their maximum tilt away from the sun. In the northern hemisphere, the winter solstice occurs in December, and it is when we have the least amount of daylight of any time of the year, as the sun is at its lowest daily maximum elevation in the sky. Although commonly viewed as the beginning of winter, the term “midwinter” has historically been applied to describe the event, which represented a salient point of transition in the prehistoric annual cycle as the gradual narrowing of daylight hours reverses. Even as the Earth closes in on the December solstice, the banking system is drifting toward its own transition after a decade and a half of easy monetary policy and the fiscal stimulus from the COVID pandemic fades into the distance.
At its core, banking is a highly fragmented commodity business with correspondingly thin profitability metrics. The following chart illustrates the average net interest margin (NIM) earned by our coverage universe of 20 domestic banks since the end of the recession that followed the Global Financial Crisis (GFC). Simply stated, the NIM measures the yield on the banks’ loan and securities portfolios, minus the cost of funding. Since prevailing interest rates and the slope of the yield curve are driven by forces outside of the system’s control, banks have limited discretion in the pricing of loans and the rates paid on deposits and market funding.
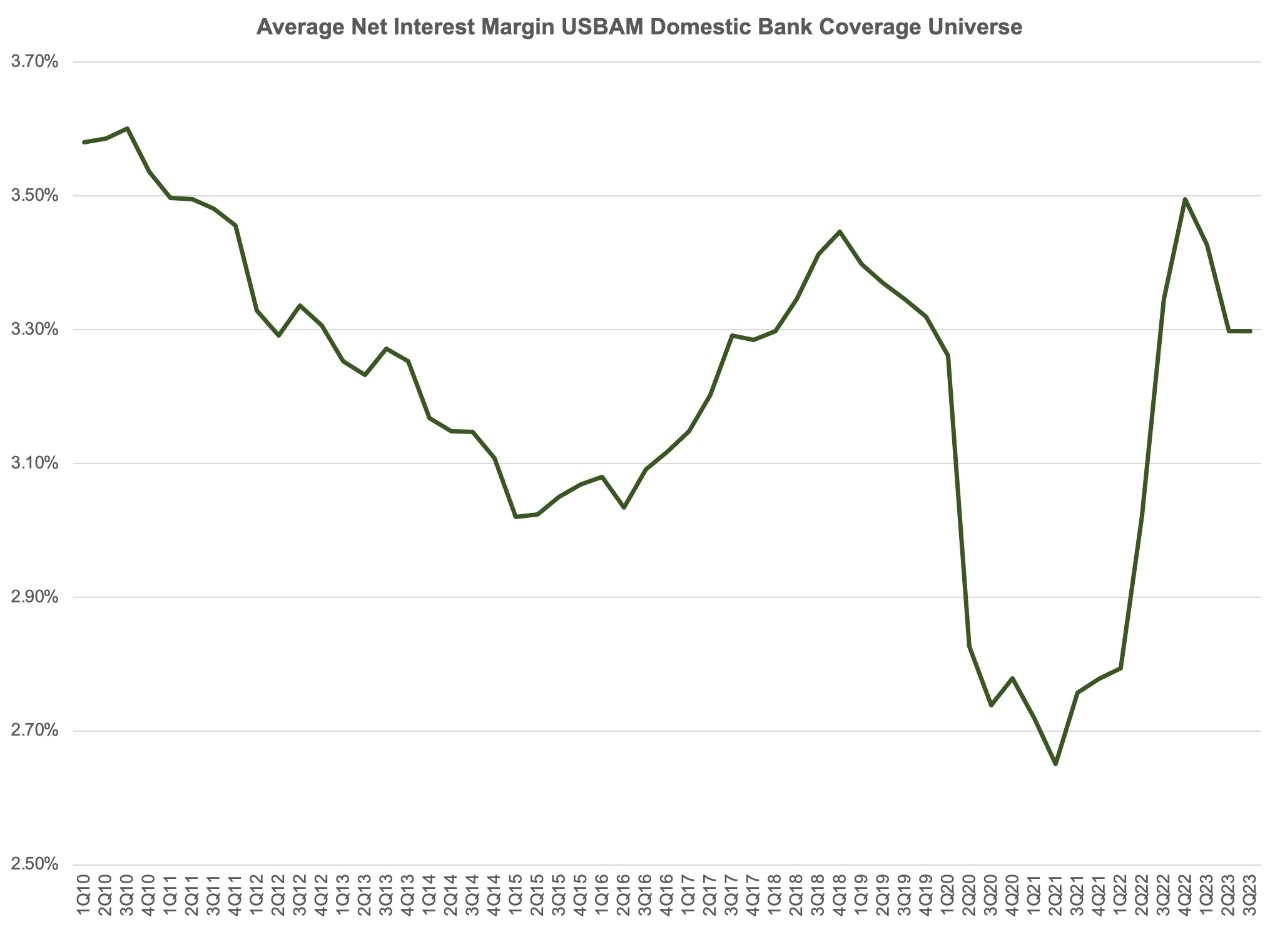
The NIM has tended to stay within a relatively tight band since piercing the 3.5% level in the third quarter of 2011, and the longer-term trend has been negative as the advantage of ultra-low funding costs have been diluted by similarly low yields on earning assets. The recent plunge in the NIM below 2.90% reflects the impact of quantitative easing and near zero interest rates enacted in response to the COVID outbreak, with the recent spike the result of the Federal Reserve’s tightening cycle. The rebound to the 3.50% level was ephemeral however, as higher rates have driven lower demand for loans, banks have begun tightening lending standards in anticipation of a weaker macroeconomy, and funding costs have migrated higher.
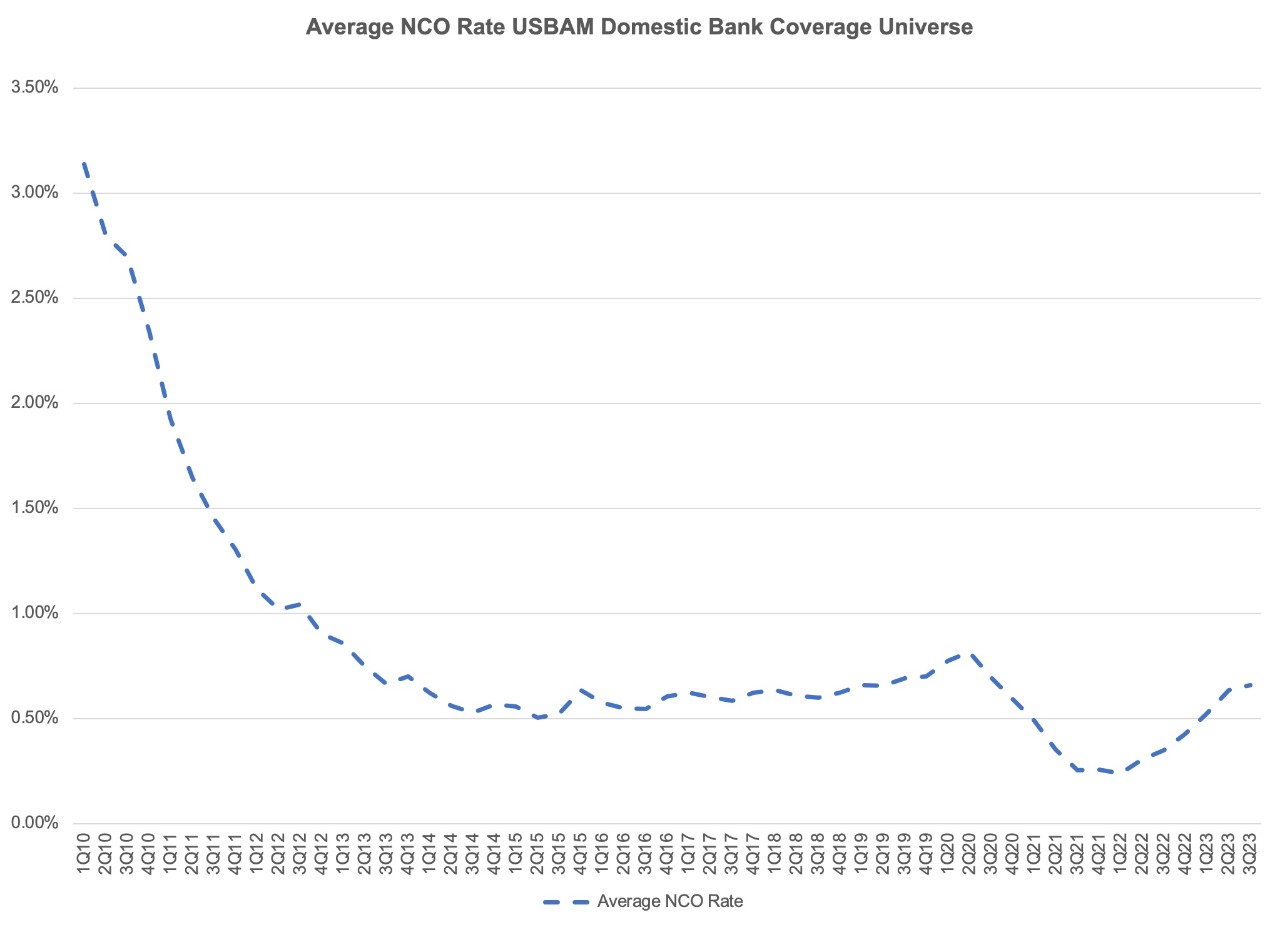
Since banks in general grow earnings by growing the size of their loan portfolios, another primary driver of earnings performance is loan asset quality, which has been supported by easy monetary policy for roughly a decade and a half. Loan losses represent a cost of doing business, and the lower loan losses translate into more revenue falling to the bottom line. The following chart tracks the net charge-off ratio for our coverage universe since the first quarter of 2010, illuminating how clean loan portfolios have remained over the past decade plus.
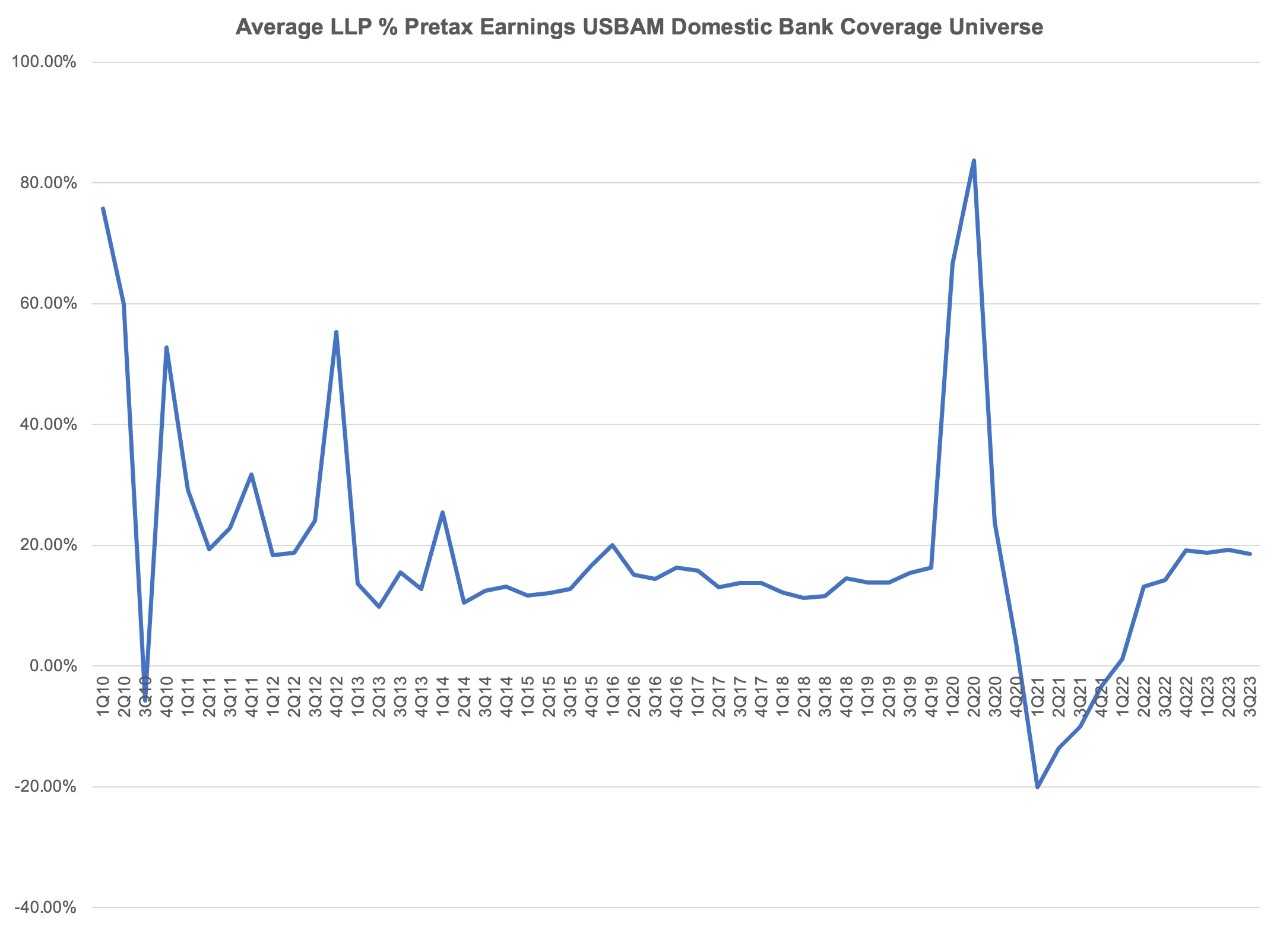
Manageable loan losses have allowed for loss provisioning typically below 20% of pretax earnings since the end of 2012, with the exception of the COVID-related reserve building in 2020 that largely reversed in 2021. However, the upward creep in loan losses across 2023 signifies that the era of limited needs for provisioning is drawing to an inevitable close with higher levels of reserve building likely moving into 2024.
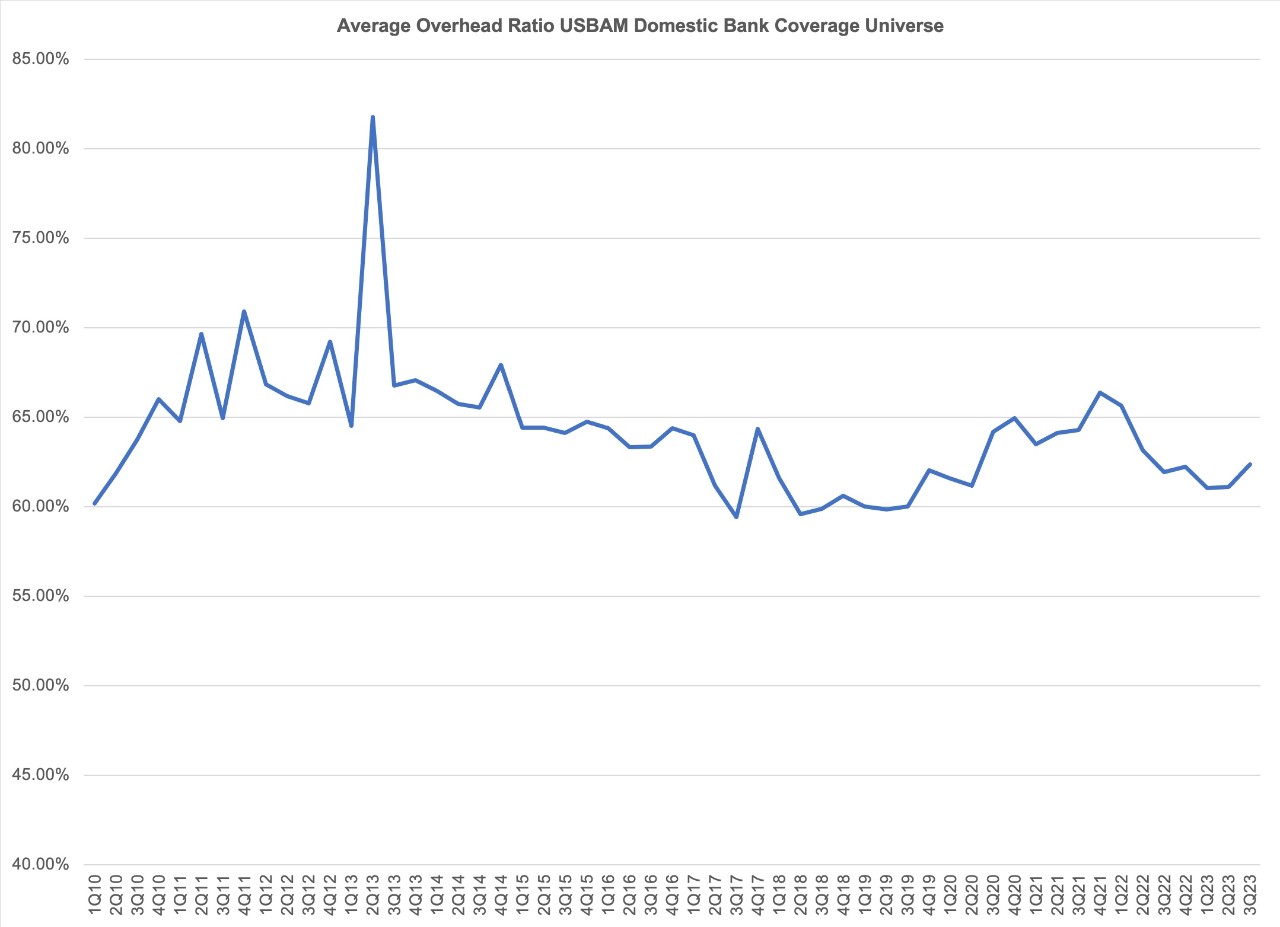
One lever that banks can use to offset tighter margins and erosion in asset quality is management of operating expenses. The following charts the average overhead ratio (noninterest expenses / total net revenue) for our coverage universe. Despite visible improvement since 2014 the overhead ratio has remained stubbornly above 60%, and recent company presentations have tended to emphasize improving operating leverage over coming periods.
Toward that end, the system has been reducing its physical footprint at an accelerating pace since the pandemic with total branches operated by FDIC supervised institutions declining (18%) to 69,905 at the end of 2022 versus the 2009 peak, half of which has occurred since the end of 2019. Absent the opportunity to close branches and leverage technology, the next obvious choice is to consolidate to capture as much synergy as possible. Since 1985, the number of FDIC supervised institutions in the U.S. system has been reduced from roughly 14,500 to 4,614 at the end of Q3 2023, including 28 that merged voluntarily in the most recent quarter.
Ultimately the operating environment for the banking sector into 2024 will include rising impairments that will drive increased loss provisioning to maintain adequate reserves, and narrower net interest margins on weaker loan origination. Those two forces in turn will steer the system to a more intense focus on operating leverage, with escalating levels of consolidation both internally via branch closures and externally via mergers. Those banks that successfully navigate the shifting climate of lower earnings should be expected to be larger, more efficient, and with stronger balance sheets when the transition to more benign conditions occurs.
Sources
Company Filings
FDIC
USBAM Research