Loan Lee at the Top
June 4, 2021
Principal Credit Analyst Rob Hajduch discusses the domestic banking system loan growth drought seen in 2020.
Rob Hajduch, Principal Credit Analyst
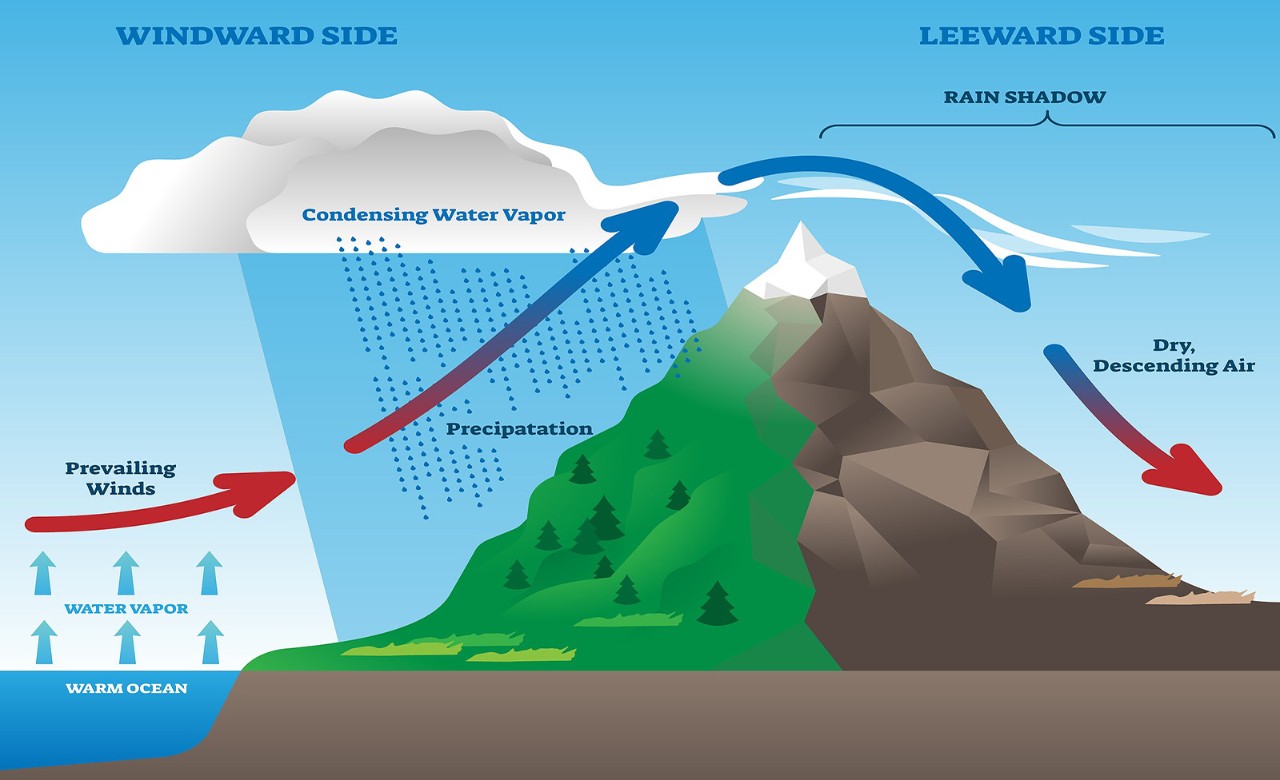
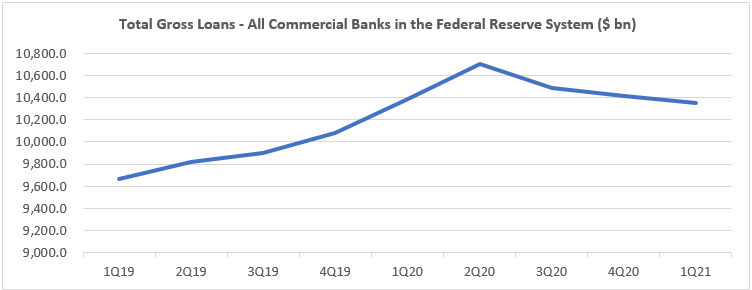
In meteorology, leeward or “lee”, refers to the side of a mountain range opposite the direction from which the prevailing wind blows. The lee side of mountains tends to be arid as most moisture carried in the air condenses and falls to the ground as rain or snow on the opposite side of the range (the windward side). Similarly, the domestic banking system appears to have entered a loan growth drought after the sharp increase in total loan balances in the first two quarters of 2020. The increase in loan balances was driven by commercial borrowers drawing down their lines of credit and Federal stimulus programs (specifically the Paycheck Protection Program) at the beginning of COVID-19 lockdowns. Over subsequent quarters, commercial borrowers with access to capital markets tapped bond markets to repay bank lines as consumers concurrently were de-levering. Total outstanding loans in the system have consequently declined by more than $355 billion from the peak level of $10.7 trillion reported at the end of the second quarter of 2020.
Typically, this level of attrition would represent a substantial earnings headwind as banks grow earnings by growing their balance sheets. This cycle, if nothing else, has proven to be highly atypical on a number of levels, however. A secular decline in lending is to be expected in any economic downcycle, which normally tracks closely with loan asset quality deterioration. The following chart illustrates the spikes in net loan losses as a percentage of average gross loans in the domestic banking system, with spikes in the late 1980s into the early 1990s corresponding to the Savings & Loan and Farm Crises and the more recent Global Financial Panic across 2008 into 2010 visibly obvious. The encircled section of the chart roughly corresponds to the onset of the global pandemic through the end of the first quarter of 2021. Not only did loan losses not materially rise across the down cycle, they declined to the lowest level as a percentage of average gross loans since the first quarter of 1985.

The banking system reacted rationally to the increase in outstanding loan balances in the face of an economic crisis, with loan loss reserves built aggressively in the early quarters of 2020 through loan loss provisioning taken out of earnings, as illustrated in the following chart. As the expected spike in loan losses never materialized and loan portfolios began to shrink, the system was allowed to release loan loss reserves, with the average amount falling to the bottom line among our coverage universe equivalent to an unprecedented 20% of pretax earnings in the most recent quarter.

Clean loan asset quality is always supportive of bank credit fundamentals. It is especially so now in sustaining earnings performance and organic capital generation in a period of anemic credit growth. Additionally, demand for credit appears to be emerging as the vaccination rate rises and the economy continues to reopen as total system loans have increased $12.4 billion through May 12, 2021, vs. the end of the first quarter. Only a drizzle at this point, but coupled with the fact that the system is exiting the down cycle in a position of strength, is reassuring and reinforces our conviction with respect to our positioning within the sector.
Sources
Catalina Island Marine Institute, A Lesson in Meteorology: Winward and Leeward
Company Filings
USBAM Research
U.S. Federal Reserve Bank