Quarterly Portfolio Manager Commentary
March 31, 2024

Cash Management Portfolios
What market conditions had a direct impact on the bond market this quarter?
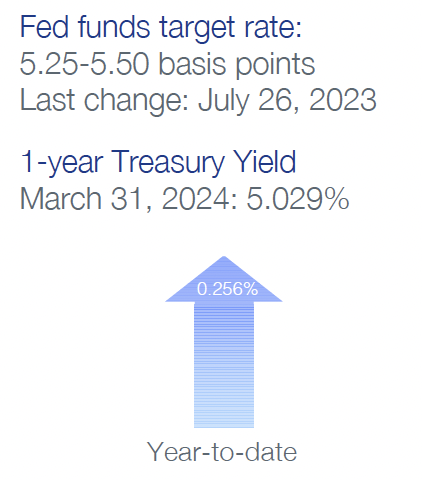
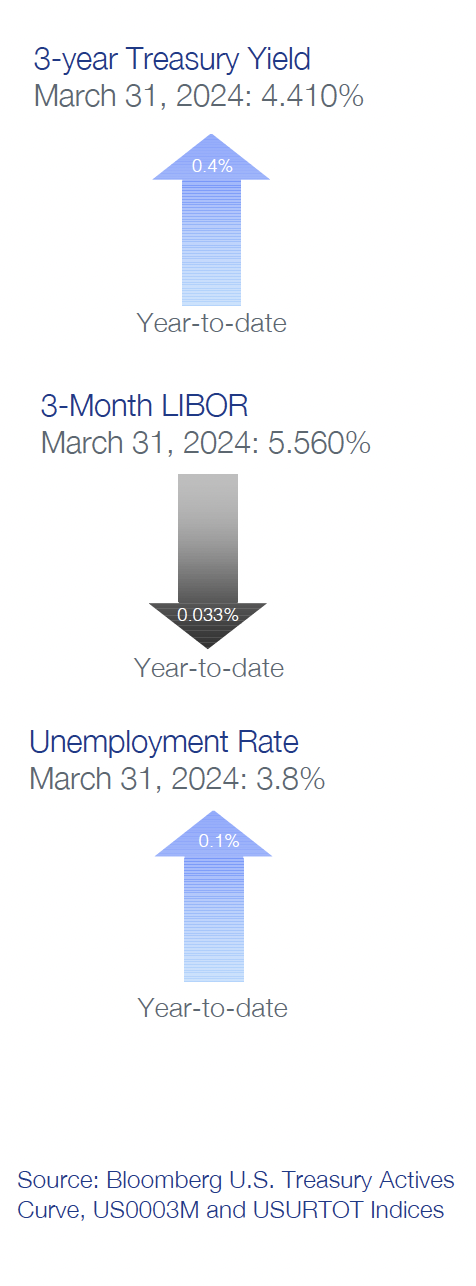
Economic Activity – U.S. economic growth continues to defy expectations for a near-term slowdown, showing remarkable resilience to restrictive Federal Reserve (Fed) policies. Despite concerns over high interest rates and elevated inflation, first quarter (Q1) U.S. Gross Domestic Product (GDP) growth is projected near 2.0% to 2.5% for the quarter on solid business activity and services spending momentum. Personal consumption accelerated throughout Q1 as U.S. households continue to benefit from strong job and income gains. The labor market continues to normalize, however, the pace of rebalancing slowed in Q1. February U.S. job openings declined to 8.8 million open positions compared to 8.9 million at the end of Q4 while total unemployed workers in the labor force as of March rose to 6.4 million reflecting strong immigration and a higher participation rate. Monthly Non-farm Payrolls (NFP) growth accelerated, averaging 276,000 during Q1 and the U3 Unemployment Rate remained strong at 3.8% in March. Growth in Average Hourly Earnings is off its highs but still elevated at 4.1% year-over-year (YoY), emphasizing persistent firm labor demand. Headline inflation readings eased during the quarter, reflecting further declines in energy prices with the Consumer Price Index (CPI) at 3.2% in February versus 3.4% in December. Core inflation continued its gradual downward trend with CPI ex. food and energy rising 3.8% YoY for February compared to 3.9% YoY in December. The Fed’s preferred inflation index – the PCE Core Deflator Index – increased 2.8% YoY for February. Despite the annual improvement, progress on inflation stalled during the quarter with monthly price measures appearing to reaccelerate. Recent inflation trends validate the Fed’s decision to be patient on the start of rate cuts as more evidence of a sustained inflation decline is needed.
Monetary Policy – The Fed elected to keep its target range for the federal funds rate unchanged at 5.25% to 5.50% at the January 31 and March 20 meetings. Maintaining the target range throughout the quarter was anticipated by the market and minimal changes were made to the post-meeting statement’s characterization of the economy. Fed officials noted they need greater confidence inflation is moving sustainably toward their 2% target before reducing policy rates. The Fed continued to implement its balance sheet reduction program (quantitative tightening (QT)), with a monthly cap of $60 billion in Treasury securities and $35 billion of agency mortgage-backed securities but noted it will likely be appropriate to begin slowing the pace of QT at subsequent meetings.
The Federal Open Market Committee (FOMC) released its updated Summary of Economic Projections at the March meeting which show Fed officials anticipate faster economic growth this year along with a slightly lower unemployment rate and marginally higher core inflation. Revisions to economic assumptions in 2025 and 2026 were minimal. The median projection for the federal funds rate at the end of 2024 was unchanged at a range of 4.5% to 4.75%, reflecting continued expectations for 75 basis points (bps) of rate cuts this year despite the anticipated increase in growth. The economic projections appear to reflect a best-case scenario and suggest the FOMC no longer believes a sustained period of below-potential growth is required to bring price pressures down, implying inflation can decline towards the Fed’s 2% target without a slowdown in growth or deterioration in unemployment.
Fiscal Policy – During the quarter, Congress narrowly avoided a government shutdown by passing two annual appropriation bills in March which will fund the federal government through the remainder of fiscal year 2024 (end September). Overall spending levels are in line with the $1.6 trillion set as part of last year’s debt limit agreement which keeps nondefense discretionary spending flat in 2024 while capping growth at 1% in 2025. With defense spending set to increase about 3% in 2024 these levels imply a reduction in real spending over the next two years and suggest government spending will have a modest dampening effect on economic growth in 2024 and 2025.
Looking further out, the Infrastructure and Jobs Act (2021) and Inflation Reduction Act (2022) will boost government spending over the long-term, but near-term impacts are likely to be minor. On the municipal side, state and local government finances are starting to diverge with municipal entities more dependent on sales and property taxes faring better than those dependent on income taxes, but strong reserves have left the overall sector in a solid position if economic conditions weaken further.
Credit Markets – U.S. Treasury yield curve levels moved higher in the quarter as stubbornly firm inflation data and better than expected economic growth pushed out the start of anticipated 2024 Fed rate cuts. While the move higher was significant, yield curve volatility was more subdued in the quarter with fewer major intra-day rate moves than in previous periods. Despite QT and what are likely peak Fed policy rates for this cycle, financial conditions remain accommodative and continue to support credit spreads. Elevated index yields and tighter credit spreads provided a cushion against the negative price action of higher rates, with credit sensitive and short treasury indexes posting overall positive returns for
the quarter.
Yield Curve Shift
|
U.S. Treasury Curve |
Yield Curve 12/31/2023 |
Yield Curve 3/31/2024 |
Change (bps) |
|---|---|---|---|
|
3 Month |
5.332% |
5.362% |
2.9 |
|
1 Year |
4.762% |
5.024% |
26.2 |
|
2 Year |
4.250% |
4.620% |
37.0 |
|
3 Year |
4.009% |
4.409% |
40.0 |
|
5 Year |
3.847% |
4.212% |
36.5 |
|
10 Year |
3.879% |
4.200% |
32.1 |
Duration Relative Performance
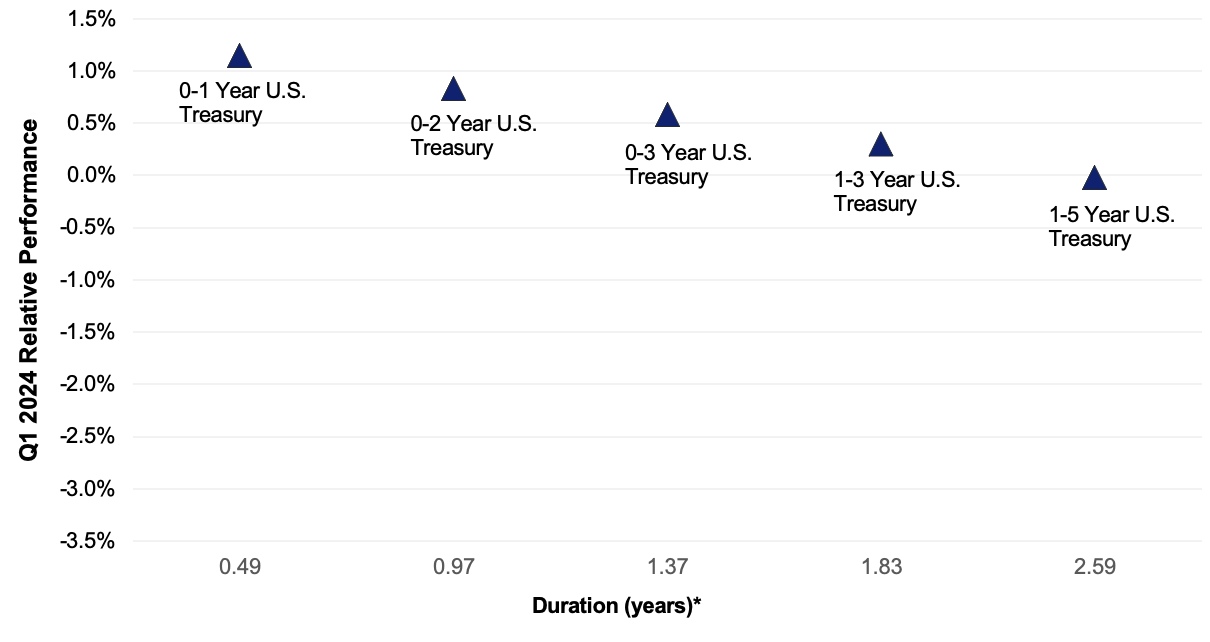
*Duration estimate is as of 3/31/2024
As expected, when rates move higher, short duration strategies outperformed longer strategies in the quarter. The three-month to five-year portion of the yield curve steepened 37.1 bps in the quarter, benefitting a more bulleted portfolio structure.
Credit Spread Changes
|
ICE BofA Index |
OAS* (bps) 12/30/2023 |
OAS* (bps) 3/31/2024 |
Change (bps) |
|---|---|---|---|
|
1-3 Year U.S. Agency Index |
10 |
9 |
-1 |
|
1-3 Year AAA U.S. Corporate and Yankees |
10 |
10 |
0 |
|
1-3 Year AA U.S. Corporate and Yankees |
34 |
29 |
-5 |
|
1-3 Year A U.S. Corporate and Yankees |
65 |
55 |
-10 |
|
1-3 Year BBB U.S. Corporate and Yankees |
97 |
85 |
-12 |
|
0-3 Year AAA U.S. Fixed-Rate ABS |
69 |
55 |
-14 |
Option-Adjusted Spread (OAS) measures the spread of a fixed-income instrument against the risk-free rate of return. U.S. Treasury securities generally represent the risk-free rate.
Credit spreads continued to tighten as unexpectedly strong first quarter economic growth, improving prospects for an economic soft landing and accommodative financial conditions supported the outlook for credit and spread product. Continuing a recent trend, credit spreads on lower-rated issuers outperformed as concerns over slowing growth and corporate refinancing risk eased. AAA-rated ABS spreads were noticeably tighter despite deterioration in sub-prime consumer debt performance. AAA-rated ABS spreads and single-A U.S. corporate debt ended the quarter with identical OAS spreads.
Credit Sector Relative Performance of ICE BofA Indexes
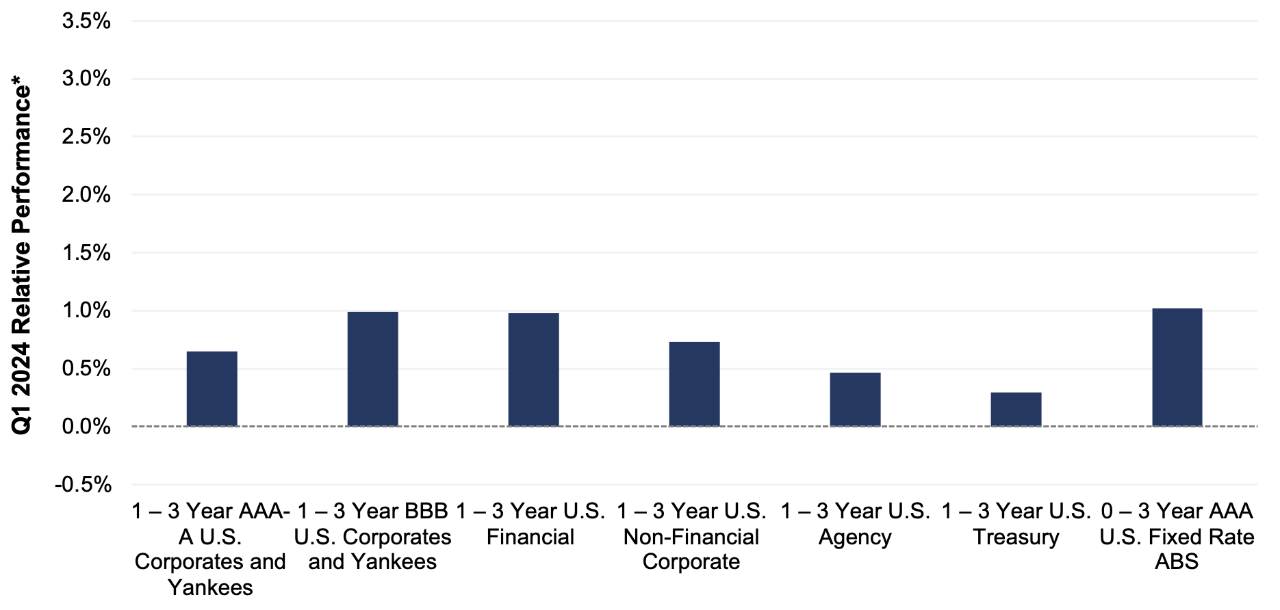
ICE BofA Index
*AAA-A Corporate index outperformed the Treasury index by 35.3bps.
*AAA-A Corporate index underperformed the BBB Corporate index by 33.8bps
*U.S. Financials outperformed U.S. Non-Financials by 26.0 bps
The trend of U.S. financials outperforming non-financial corporate debt continued. The financial index saw greater credit spread tightening in the quarter and at the same time retained a 16 bps OAS spread advantage over the non-financial index (73 bps vs. 57 bps) at quarter-end.
What strategic moves were made and why?
Taxable Portfolios – Despite the significant jump in U.S. Treasury yields, most short fixed-income portfolios and indexes generated positive returns in the quarter. Elevated portfolio yield-to-maturity levels and tighter credit spreads cushioned portfolios against the negative price action of higher rates. As expected when yields move higher, shorter duration strategies outperformed their longer duration counterparts. Credit strongly outperformed U.S. Treasuries on higher coupons and spread tightening in the quarter, particularly for ABS, financials, and A- and BBB-rated corporate debt in general. There were no significant credit or rating events in the quarter, and no single issuer or position had a meaningfully negative impact on portfolio performance.
Tax Exempt and Tax-Efficient Portfolios – We entered 2024 with a cautious view toward municipal bond prices. This near-term outlook was based on both stretched relative yields versus treasuries, as well as the aggressive expectations across fixed income markets for Fed easing. We witnessed movement in both areas, leading yields for tax-exempt securities with one- to three-year maturities to rise 40 to 60 basis points. Municipal new issuance YTD has been well above typical Q1 levels. This year's steady supply of new bonds now total more than $90 billion, an increase of about 50% versus the same period in 2022. If not for strong reinvestment demand, the move toward cheaper municipals versus treasury relative ratios would have been more forceful – but these ratios did edge higher. Our trading activity was subdued. Some accounts favored variable rate demand notes (VRDNs) for their liquidity and higher current yields. For other mandates, we did some modest extension trades late in March. These trades were initiated to opportunistically bring portfolio durations closer to benchmark levels and also to reduce underweights to three- to five-year maturity buckets.
How are you planning on positioning portfolios going forward?
Taxable Portfolios – The back-up in U.S. Treasury yields offers an opportunity to extend fixed income portfolios closer to or at benchmark duration. Quarter-end yield curve levels represent solid entry points, and we believe the balance of risks is skewed toward lower rather than higher rates in the second quarter. We base this outlook on our view; 1) we have reached peak policy rates, 2) the Fed’s reaction function is asymmetric, as policymakers will tolerate stronger economic or employment data but are prepared to ease should conditions weaken, and 3) the market is biased to take rates down, meaning the weight of evidence must convincingly be on the side of sustained or re-acceleration of growth and/or inflation to move yield curve levels meaningfully higher. Credit spreads have performed well in recent quarters, and certain measures indicate corporate credit – particularly high-quality industrial issuers – are tight from a historical level. Despite tighter credit valuations, we will maintain on overweight to credit as improved prospects for a soft landing enhance and accommodative financial conditions bolster the outlook for corporate credit quality, and in turn, the relative value of corporate credit spreads. While consumer credit metrics show signs of deterioration, particularly for sub-prime borrowers, we continue to focus on well-structured prime auto, credit card and equipment loan AAA-rated ABS yielding comparable to single-A rated corporates.
Tax Exempt and Tax-Efficient Portfolios – Municipal bond reinvestment from April maturities and coupon payments is relatively low versus other months, and tax season may lead to outflows from municipal bond funds or increased bid wanted activity. We believe each of these factors should work in the favor of buyers. Further, the fixed income market’s current assessment of future Fed activity now appears quite reasonable. This presents a good setup for us to extend and better align portfolio durations with benchmarks, though we are mindful that economic conditions can change quickly. Also, municipal market technical conditions are expected to strengthen again into the summer months. As a result, the window for buyers may not be open for long. Our immediate focus will be on sourcing bonds with absolute yields near or above 3% and locking in this return for the next three to five years. Security selection and careful credit analysis will be paramount in this pursuit.
Sources
Bloomberg
https://www.wsj.com/politics/house-senate-government-shutdown-vote-fccc16e6?mod=politics_lead_pos3
https://www.wsj.com/politics/policy/house-to-approve-six-spending-bills-leaving-six-still-to-go-60b1b8e2?mod=series_governmentshutdown
https://www.wsj.com/articles/whats-in-the-debt-ceiling-deal-461b9822?mod=us_lead_pos1
https://www.federalreserve.gov/monetarypolicy/files/monetary20240320a1.pdf
https://www.federalreserve.gov/monetarypolicy/files/fomcprojtabl20240320.pdf
https://www.federalreserve.gov/monetarypolicy/files/monetary20240131a1.pdf